This is summary of COVID-19 trends today, by countries, US states, and California counties.
Summary
| Daily Cases | Daily Growth | |
| World | cold (17 DCPM) | warm (1.6%) and slightly warming |
| United States | cool (91 DCPM) | very warm (4.2%) and warming |
| California | cool (96 DCPM) | very warm (3.7%) and warming |
Graph of the Day
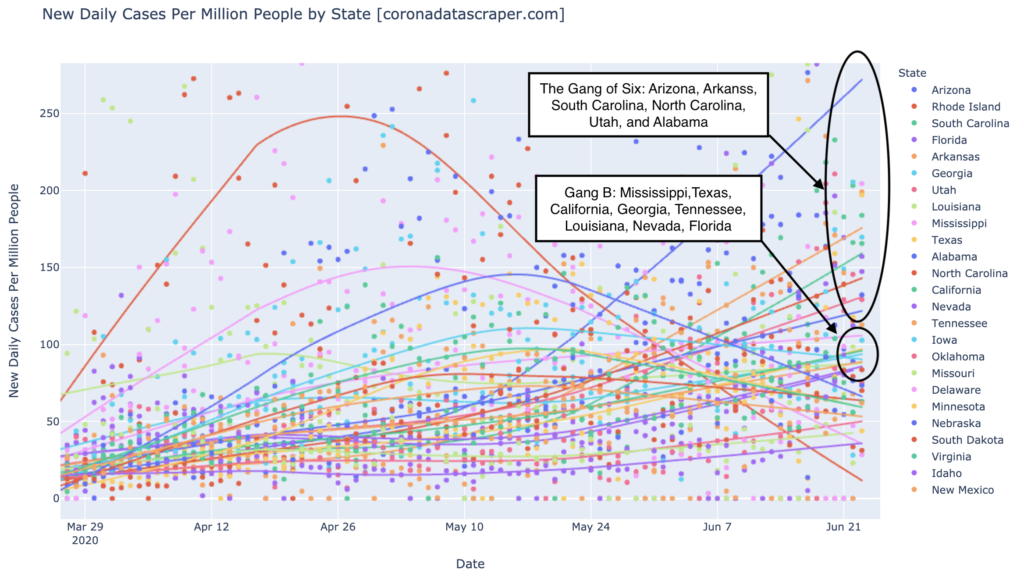
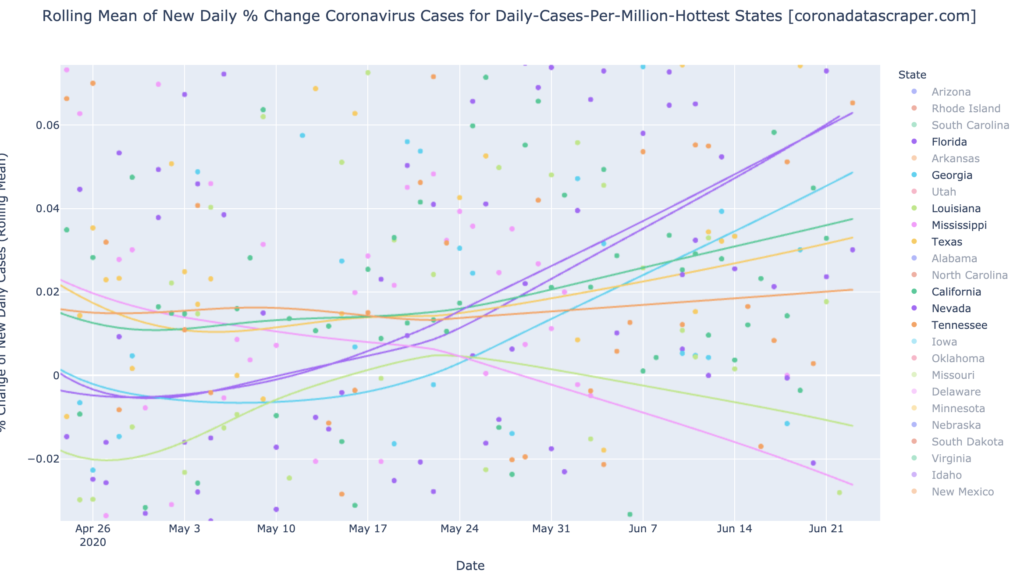
Here is the leading cluster, and following cluster of US States, in daily cases per million:
Countries of the World
Interactive source graphs, where you can select regions, zoom, etc., are here.
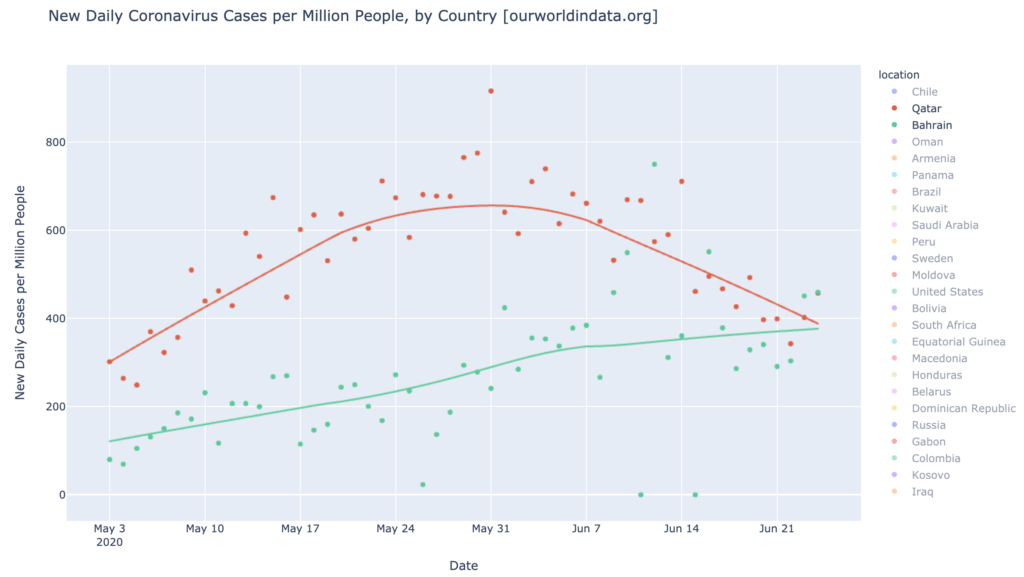
Qatar Recovers, Bahrain Not So Much
Qatar is still the hottest country in the world in daily cases, but just barely now; it has dropped to join its neighbor Bahrain at 380 DCPM. Bahrain, which has recently been second place and has generally moved together with Qatar, is continuing a slight upward trend even while Qatar recovers, and will soon be number one:
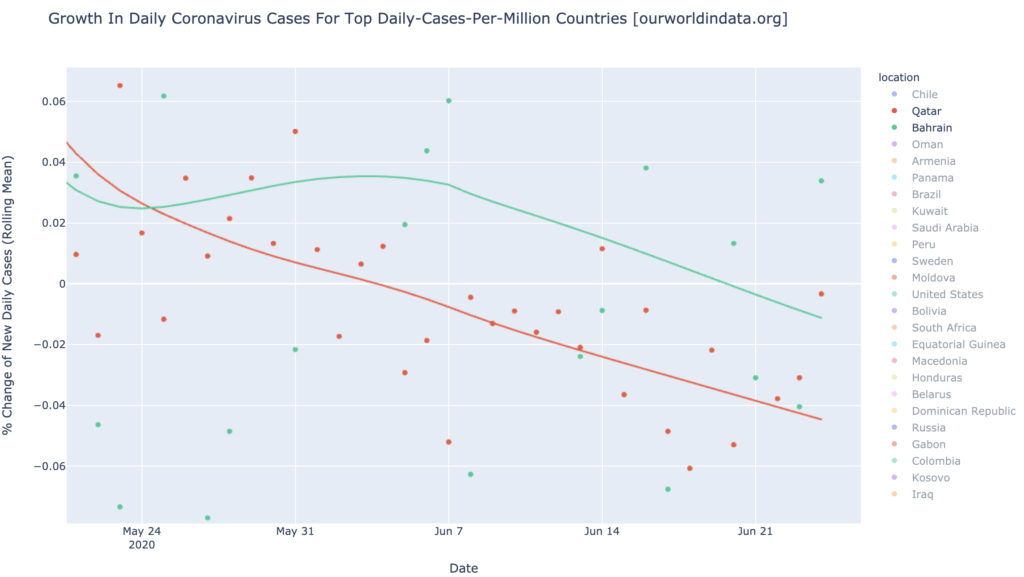
Both Qatar and Bahrain are headed in a good direction growth-wise, though, having peaked in growth and now falling, or soon to be falling, in daily new cases:
Central/South America is Hot But Heading Toward Recovery
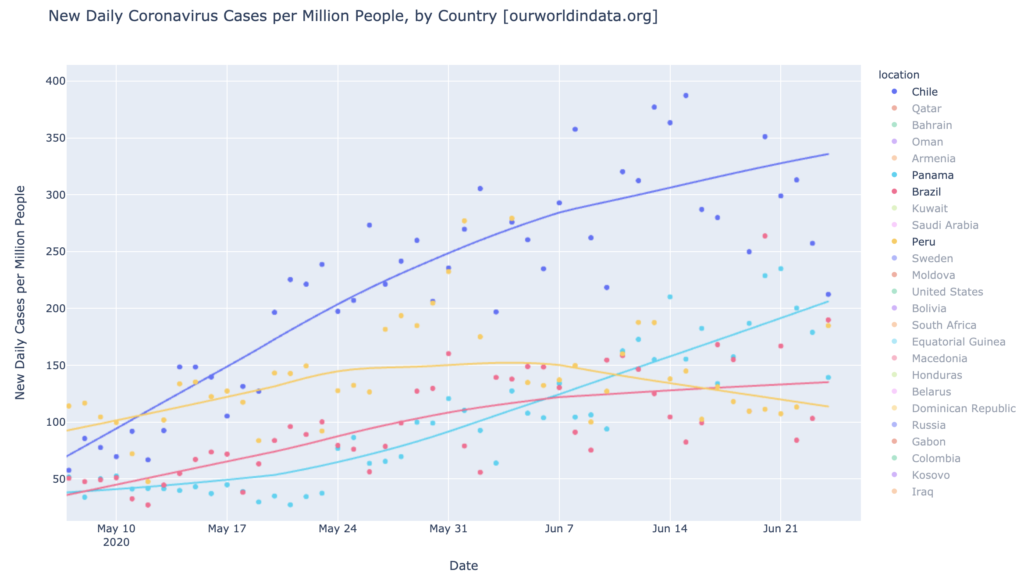
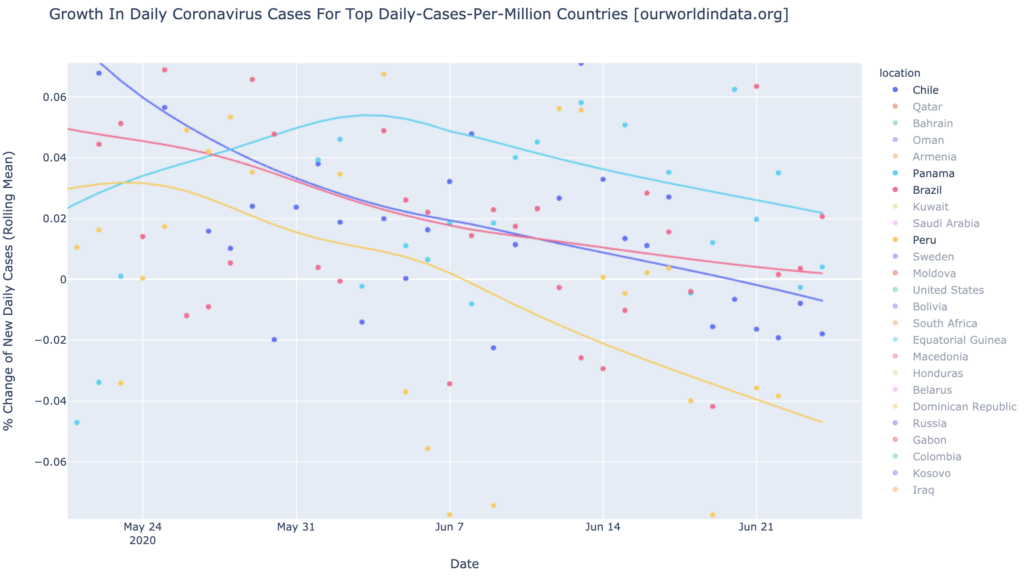
The epicenter we’ve been tracking in Central/South America is still a daily-cases hotspot (especially Chile at 340 DCPM and Panama at 210 DCPM):
But all the warmest countries of Central/South America are cooling in growth; three of them have crossed zero growth and are now shrinking, or soon to be shrinking, in daily cases. Only Panama is still growing, and is a growth warmspot at 2%; but Panama is visibly trending downward toward zero growth. If these trends persist, the Central/South America epidemic will be in full recovery mode in a week or two:
The United States Growth is The New News
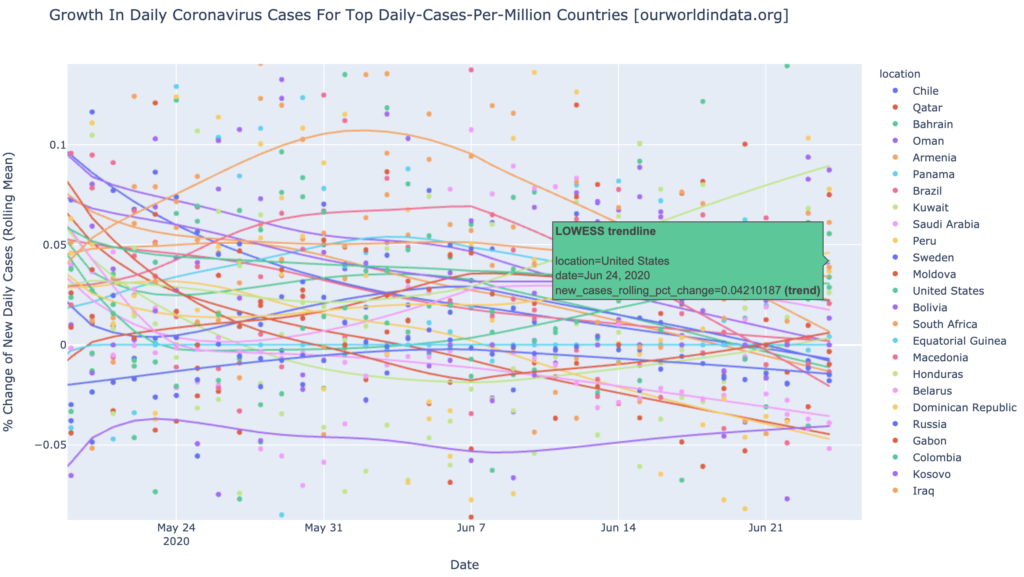
The big news among the countries is The United States. This graph is a very busy, but what it’s showing is that the green upward diagonal line, the United States, is now third-worst among the warmest DCPM countries, in growth rate. The United States is growing fast at 4.2%, a very warm growth warmspot, and is accelerating. No other large country is looking this bad right now; only Honduras and the Dominican Republic are ahead of the United States in growth:
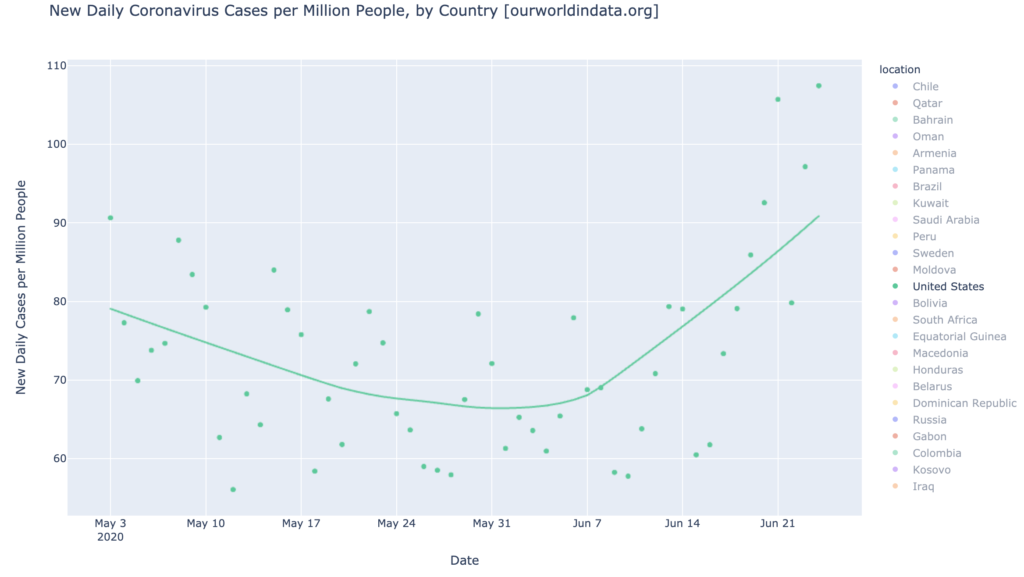
One saving factor is that the United States still doesn’t yet have a lot of cases, adjusted for population; at 91 DCPM it isn’t even a daily-cases warmspot. But it’s headed there quickly:
States of the United States
Interactive source graphs, where you can select regions, zoom, etc., are here.
The Gang of Six, and Gang B
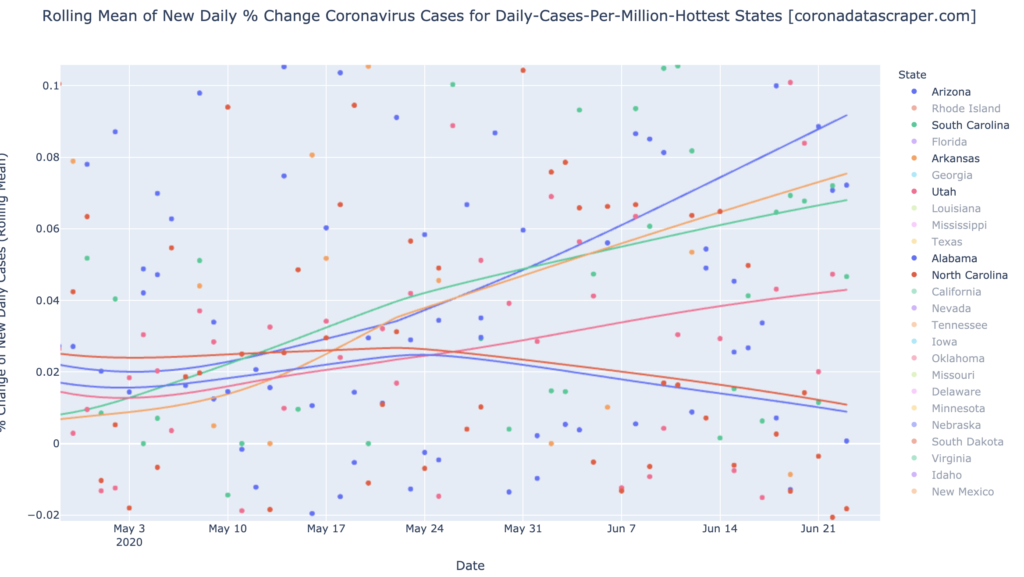
We’ve been watching the Gang of Six for a while, and they, especially Arizona (the sole national daily-cases hotspot state at 270 DCPM), continue to lead the nation in cases. Just behind them is a group of states I’m calling Gang B, which is not yet warm in DCPM, but seems to be headed there:

The Gang of Six is Losing Members
There’s not a lot to be happy about on the United States COVID-19 Trends scene, but here’s one little happy place: North Carolina and Alabama (two of the Gang of Six) are peeling away from the group, and are now showing a sustained downward trend in growth rate. If these trends persist, these two states will peak and begin to decline in daily cases in about two weeks:
Gang B is Also Losing Members
Similarly, the less-hit eight states of Gang B, whole mostly growing and accelerating, do show two rays of hope: Louisiana and Mississippi are actually shrinking now in daily cases, and their shrinkage rates are accelerating:
Theory: Regions Develop Metaphorical Immunity to COVID-19
This is particular good to hear about Louisiana, because that state does not belong in this wave in my worldview, having already had its own wave a couple months ago. The pattern I’ve been seeing, and the theory I’m developing, is that once a region “catches” the virus and then “gets over” the virus, it is effectively immune from getting the virus again; it has a metaphorical immune response that stomps out any new pockets of reemergence in a matter of days. If a second, high, sustained wave had actually come to Louisiana, that would have been evidence that COVID-19 lightning really can strike the same place twice, and bad news for future of the pandemic in the rest of the world.
With this trend in Louisiana, my theory survives: Regions develop a metaphorical (non-biological) immune response to COVID-19 after being hit hard by it, and never get it badly again.
A plausible mechanism for this immunity is that it is based in testing capacity, in health care system capacity, and in fear. After a wave passes (defeated by these three factors), the three factors remain behind in force. Health care capacity, testing capacity, and fear of the virus, remain greatly elevated. I suggest that if the virus even peeks its head in the door again, it is met by vastly greater capacity and vigilance than the first time, and is quickly defeated. In this way, the metaphorical immune response of a region functions much like the biological immune system of an organism.
A corollary to this: like a biological immune response, a regional immune response can be expected to fade away, probably in a matter of months and certainly in a matter of years, as testing capacity and health care system capacity are cut because they are perceived as no longer needed (and expensive), and as the population’s fear recedes into distant memory. A true second wave, if it hits, will hit after this recession. With luck, by that time, biological immunity in the form of a vaccine will be available and widely deployed.
California Counties
Interactive source graphs, where you can select regions, zoom, etc., are here.
Hotspot Counties: Imperial et al
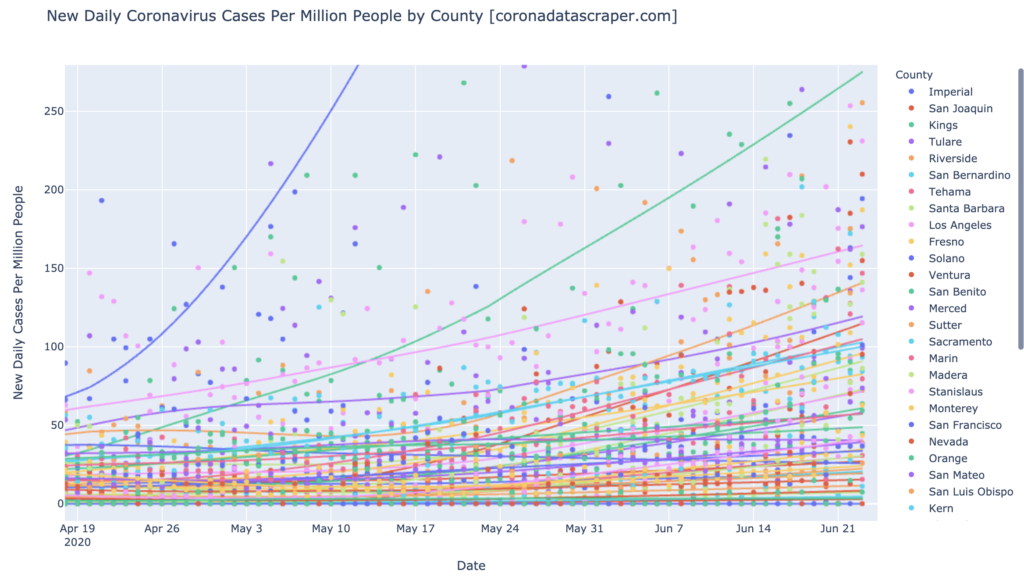
Imperial (920 DCMP) is literally off the chart in this graph, which I’ve scaled to show the other counties better. This is a “big picture” graph, just intended to show how counties are broadly doing in DCPM: most counties are cool or cold. See the interactive charts if want to know which line is which. Only Imperial and Kings (270 DCPM) are daily-cases hotspots. Warmspots are Los Angeles (160 DCPM), Riverside (140 DCPM), Tulare (120 DCPM), San Joaquin (120 DCPM), Marin (105 DCPM), San Bernadine (105 DCPM), and Kern (100 DCPM):
Warm Counties are Mostly Getting Warmer
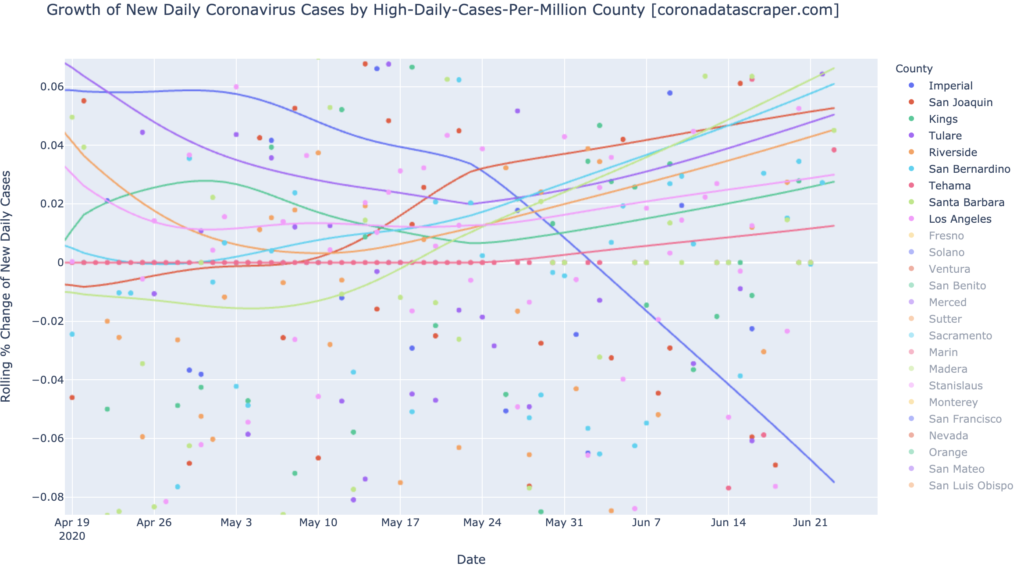
Focusing on the nine hottest counties, the trend is clear: with the only outlier as Imperial (recovering rapidly), all counties which are warm, are getting warmer, and their rate of warming is also accelerating. This is a bad combination. The one mitigating factor to remember here is that none of them, yet, have that many cases in DCPM, so there are still some weeks of runway for recovery without things ever getting really bad:
Definitions
| DCPM | Daily cases per million |
| Daily-cases warmspot | >100 DCPM but <200 DCPM |
| Daily-cases hotspot | >200 DCPM |
| Growth warmspot | >1% daily growth in new cases |
| Growth hotspot | >5% daily growth in new cases |