This is summary of COVID-19 trends today, by countries, US states, and California counties.
Summary
| Daily Cases | Daily Growth | |
| World | cold (23 DPCM) | warm (1.3% and steady) |
| United States | cool (82 DCPM) | warm (3% and warming) |
| California | cool (93 DPCM) | warm (2.5% and warming) |
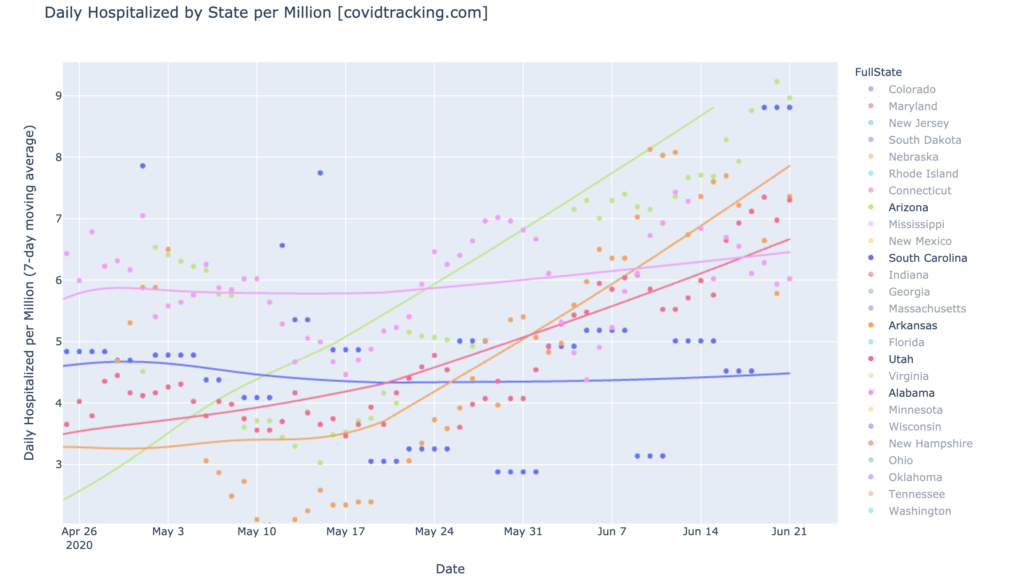
Graph of the Day: Gang of Six Hospitalizations
Today’s COVID-19 Trends Graph of the Day is a new analysis of hospitalizations by state, focused on the hottest states in daily-cases-per-million, and suggesting that the surges are caused at least in part by an increase in new infections, and not just by increased testing:
Countries of the World
Interactive source graphs, where you can select regions, zoom, etc., are here.
Hotspot Countries: Qatar, Bahrain, Chile
Worldwide, the only daily-cases hotspots are Qatar, Bahrain, and Chile, in the 300-400 DCPM range. Close behind, right around 200 DCPM, so on the edge of being daily-cases hotspots, are Panama, Oman, and Armenia.
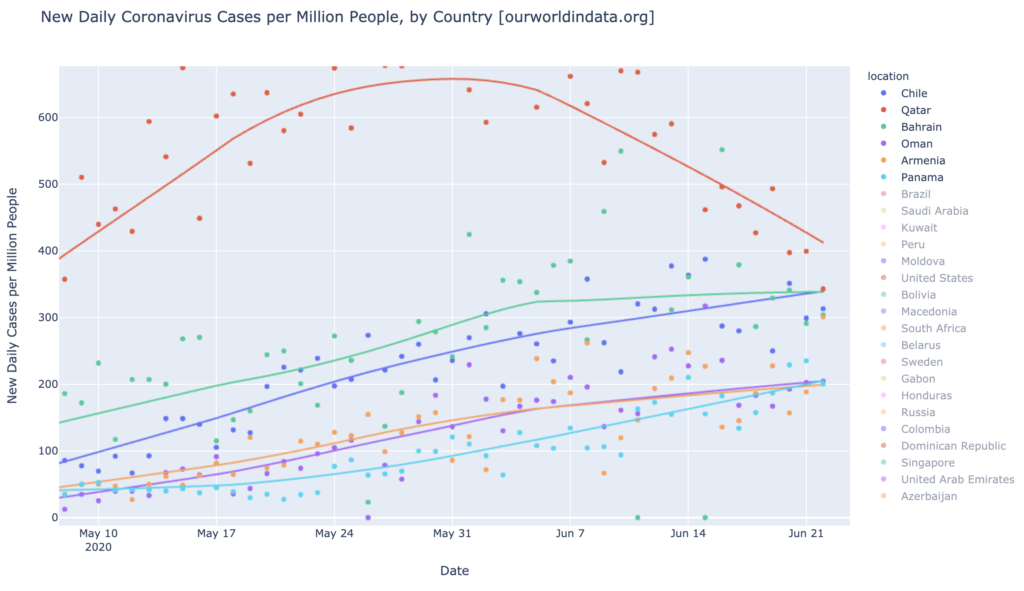
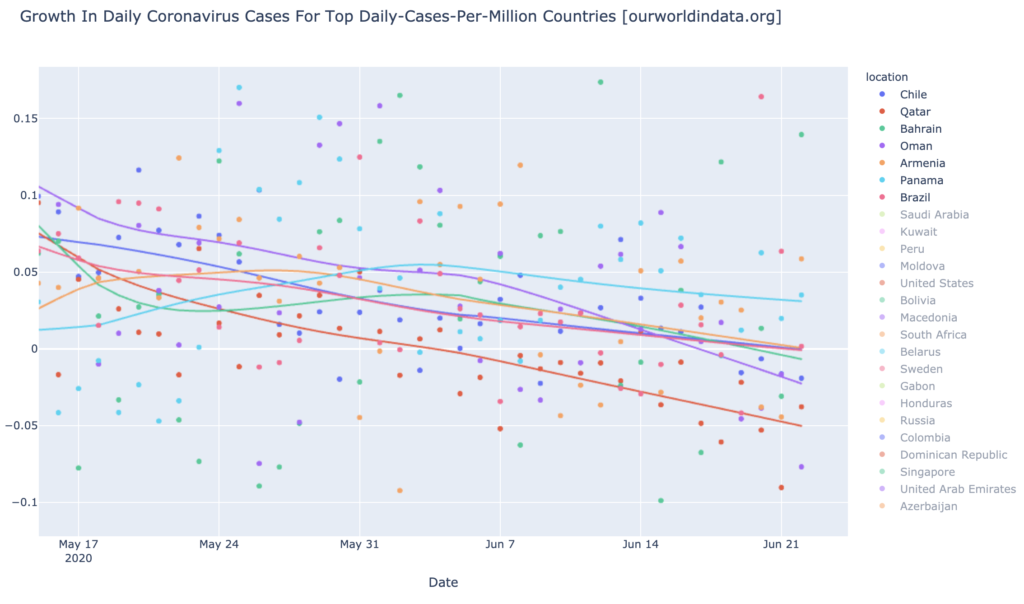
All six of these are seeing shrinking growth rates (below), and only Panama is actually growing at all anymore (the daily-cases trendlines, above, sometimes take a few days to notice a peak). So all the hottest countries in the world are trending toward recovery, and five of the six have already peaked and are shrinking, or soon will be, in daily new cases:
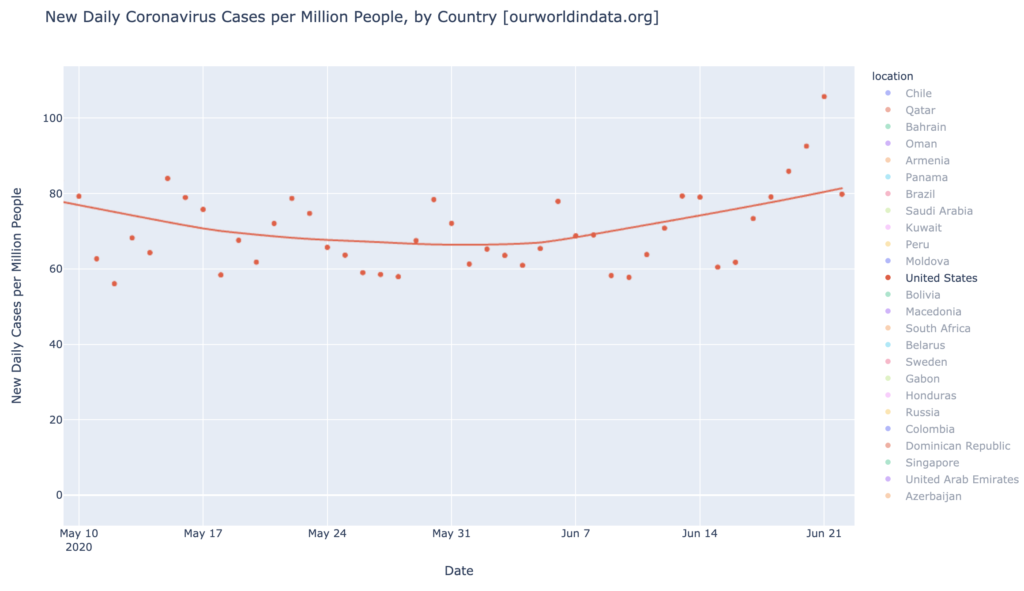
United States: Still Not Even Warm
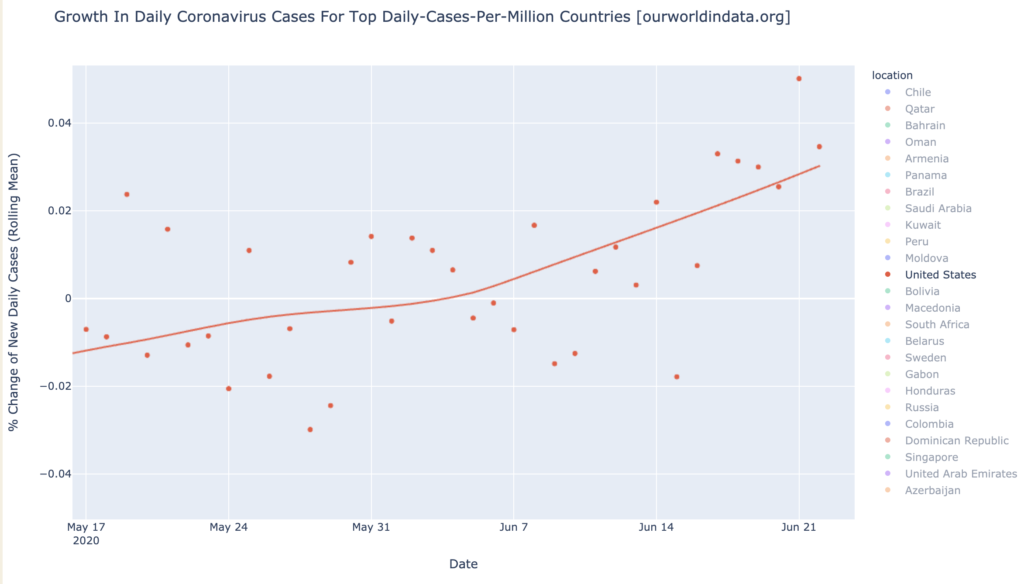
The United States lost its weeks-long downward trend in late May, and is now growing moderately and steadily in daily new cases. But at 81 DCPM, it is still not even a daily-cases warmspot:
The growth rate in daily new cases of the United States, is 3% and accelerating. This puts the United States solidly in the category of growth warmspot:
A Few Upcoming: Saudi Arabia, Modova, and Sweden?
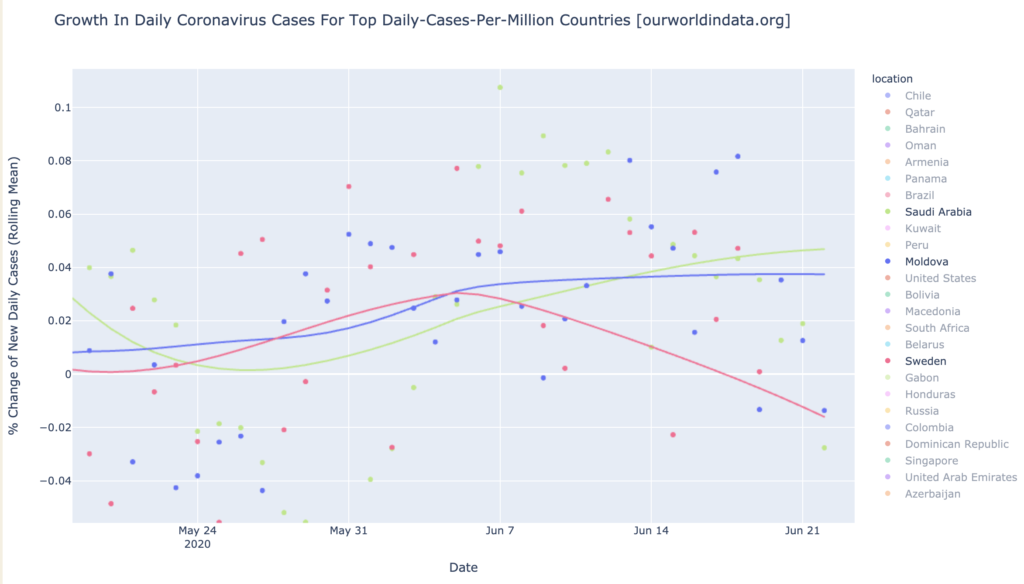
Three countries are daily-cases warmspots with rising trendlines: Saudi Arabia, Moldova, and Sweden:
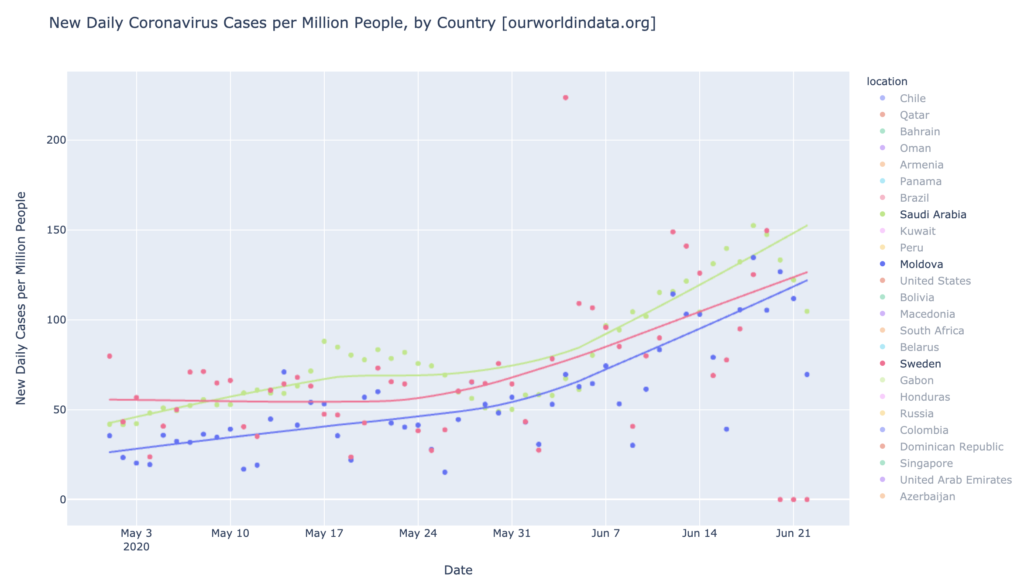
However, in the growth rate graph below, we can see that Sweden, after its brief surge, appears to be swiftly returning to join the rest of Europe in recovery. Saudi Arabia and Moldova are still growing at a relatively high 4% daily, but at least that rate is stable and not climbing. If it persists, however, these will become our next daily-cases hotspots:
States of the United States
Interactive source graphs, where you can select regions, zoom, etc., are here.
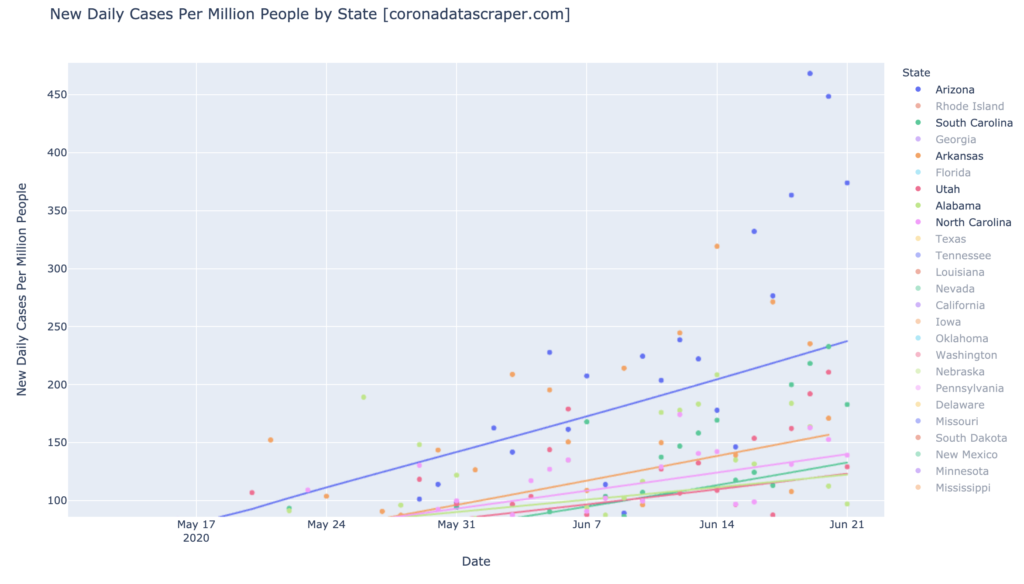
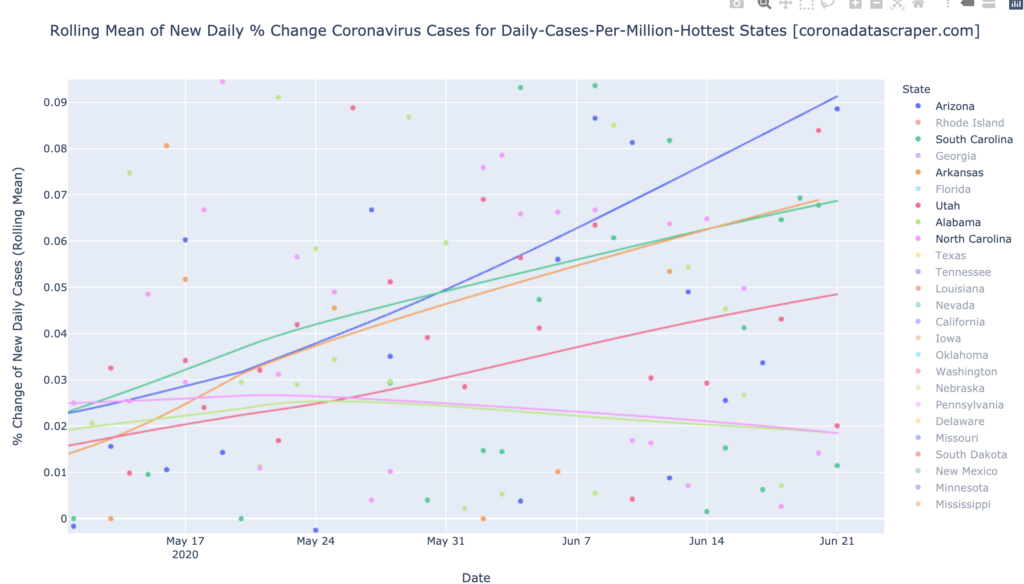
The Gang of Six: Arizona, Alabama, Arkansas, North and South Carolina, and Utah
These six states continue to be the only daily-cases warmspots, and Arizona is the sole daily-cases hotspot in the United States. But there have been some very hot days in Arizona this week, as shown by all those blue dots above the line:
The gang may be losing some members soon, though, as Alabama and North Carolina are showing pronounced downward tends in their growth rates. The other four are still looking quite bad; South Carolina, Arkanas, and especially Arizona are growth hotspots. This means that Arizona has every bad thing it could have right now: daily-cases hotspot, growth hotspot, and rapidly accelerating:
Gang of Six: Higher Testing, or More Infections?
The Gang of Six is certainly seeing a rise in reported daily cases. But is it due to the higher testing that is now being performed, or is it because there is actually a rise in the number of infections (or both)? To try to answer this sort of question, I have added a new graph of daily hospitalizations per million, by state. I would expect increased testing to have almost no effect on hospitalizations, while in increase in actual infections should result in an increase in hospitalizations. The graph for the Gang of Six is below (minus North Carolina, for which I have no hospitalization data), and clearly indicates that hospitalizations are rising in most or all of these states, suggesting that a rise in underlying infection rates, and not just a rise in testing, is the cause of the rise in daily reported cases:

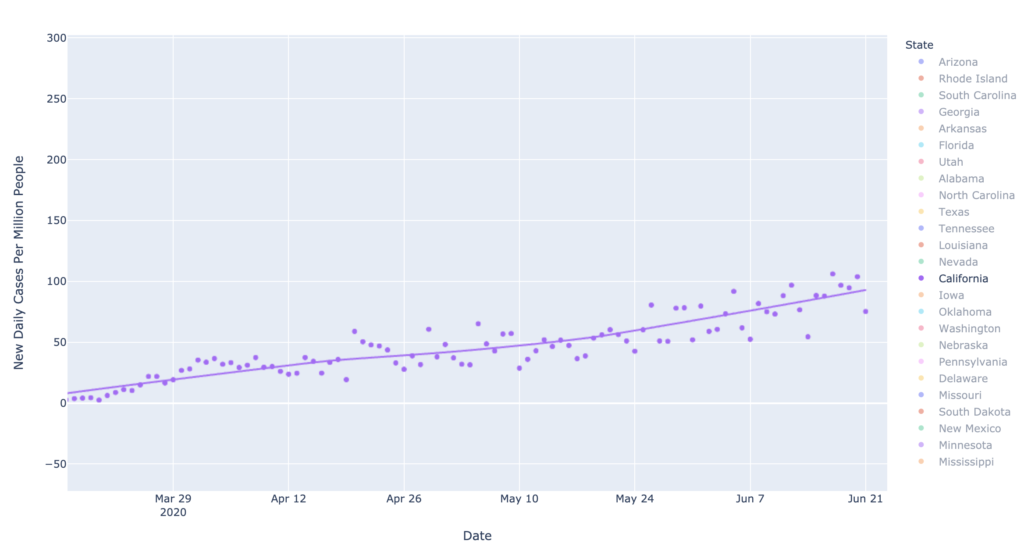
California is Slowly Sliding Downhill
Thanks to one good day just now, California has managed to avoid being called a daily-cases warmspot today; but it’s close at 92 DCPM:
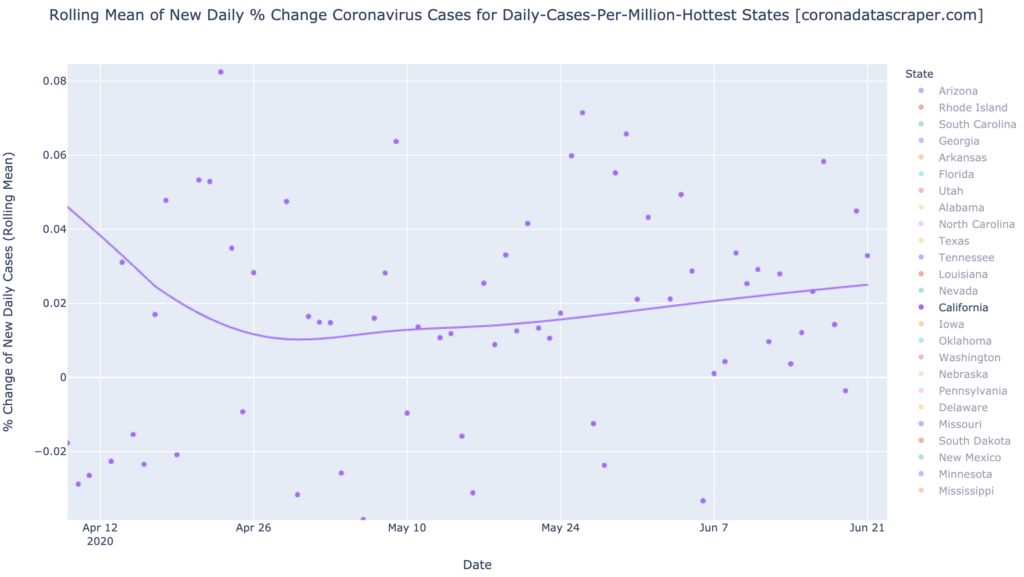
California’s growth rate continues to rise: 2.5% new daily cases and warming. So it’s not in terrible shape right now—cool in daily cases and warm in growth—but it’s slowly heading in the wrong direction:
California Counties
Interactive source graphs, where you can select regions, zoom, etc., are here.
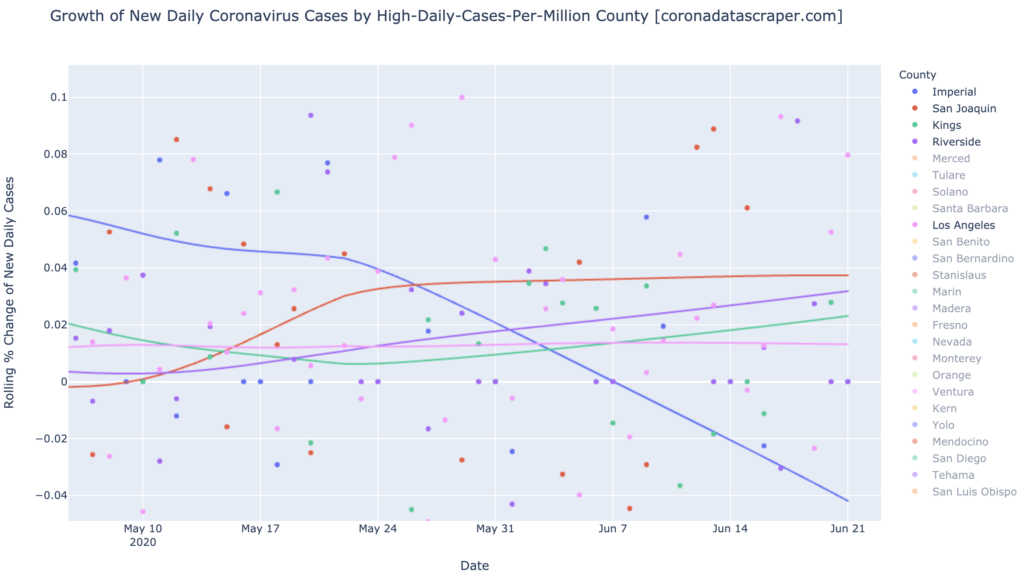
Hotspots and Warmspots: Imperial, Kings, Riverside, Los Angeles, and San Joaquin
Imperial, Kings, Riverside, Los Angeles, and San Joaquin are the only daily-cases warmspots in California (Imperial and Kings are daily-cases hotspots):
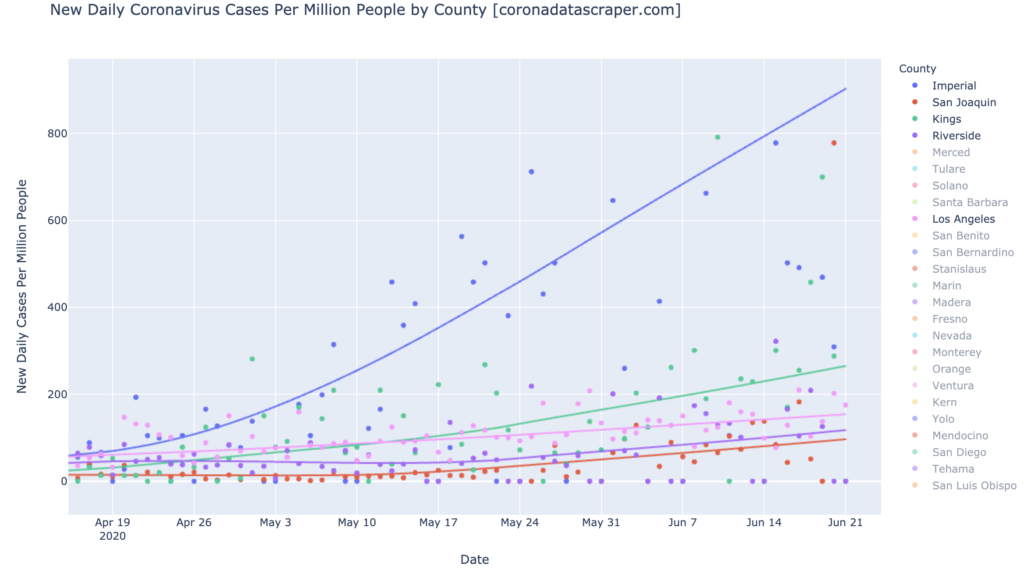
These five counties are mostly heating up still, though Imperial seems to be continuing its recovery, and Los Angeles is fairly stable in growth rate. None of them are growth hotspots:
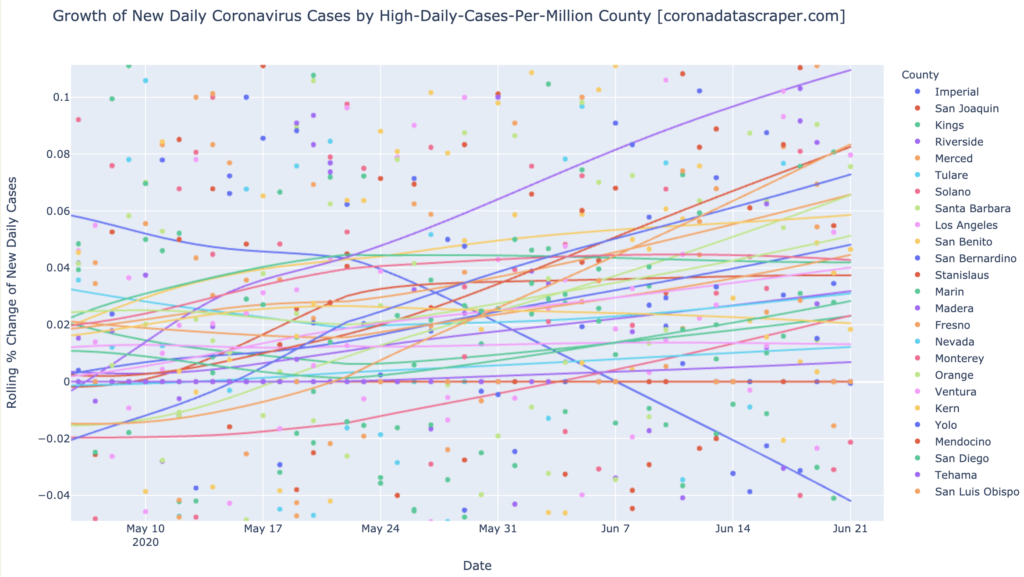
The Warmest Counties Keep Getting Warmer
The twenty-five warmest counties, shown below (using the interactive version to figure out which is which), are showing a very unhappy trend: with the single exception of Imperial, all counties are growing in new cases, and almost all are accellerating in growth rate:
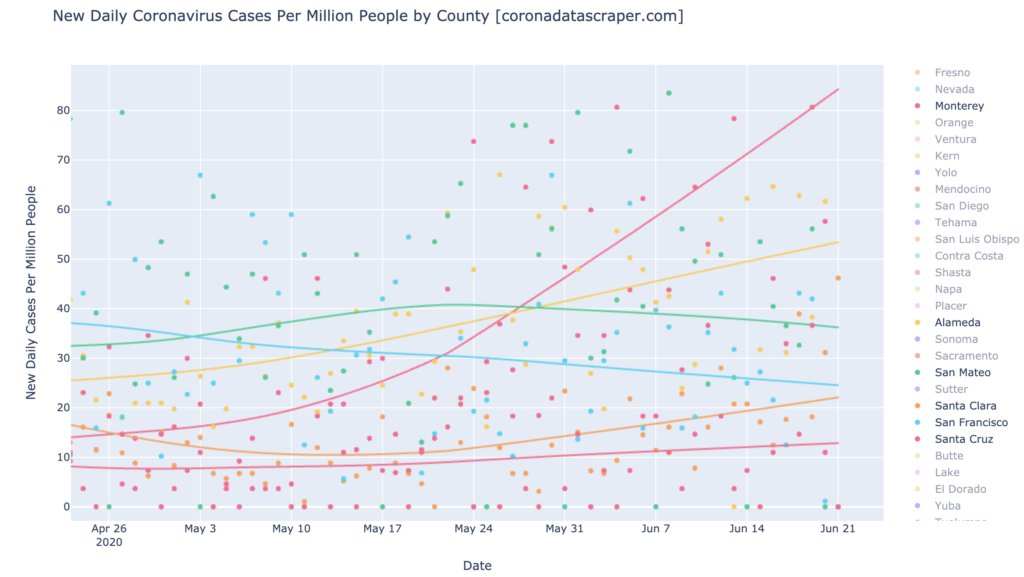
The San Francisco Bay Area
I’m based part-time in the San Francisco Bay Area, and a number of readers of this blog are also. The Bay Area doesn’t rise to prominence in my normal reporting, which is a good thing, since I’m reporting hotspots. But for comparison, here are the six Bay Area counties in the DCMP chart. None of them are daily-cases hotspots; none are even daily-cases warmspots; most are fairly stable in daily cases, and only Monterey shows any signs of becoming a warmspot in the near future.
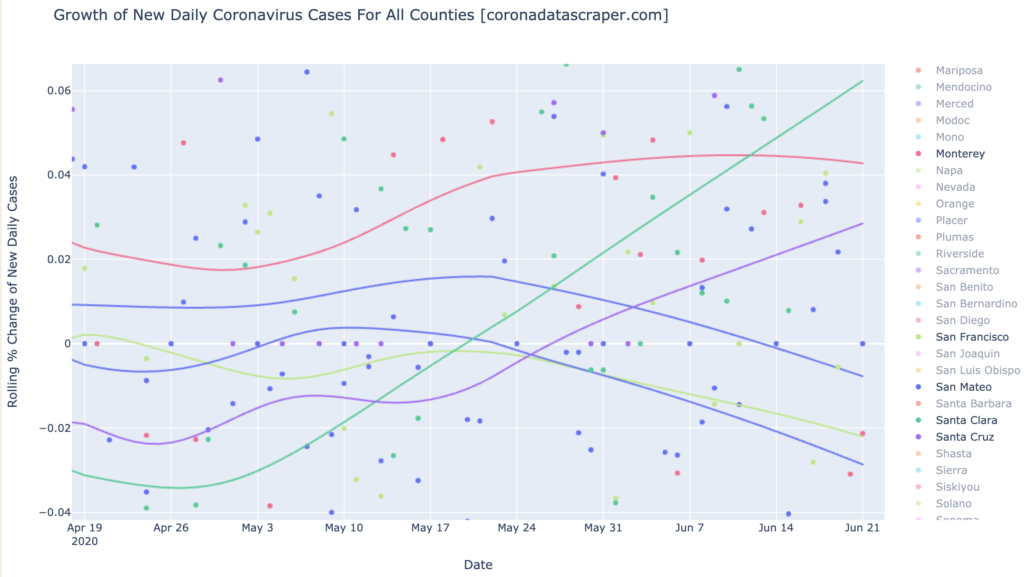
And here are the Bay Area counties in the growth chart (the two blue lines are Alameda, upper; and San Mateo, lower). Only two of them are growth hotspots and accelerating: Santa Cruz and Santa Clara. Monterey is a growth hotspot but stable. The other three are looking good in growth, with negative growth rates and cooling. Remember: none of these are even warm in total cases yet, so a high growth rate isn’t yet a serious problem:
Definitions
| DCPM | Daily cases per million |
| Daily-cases warmspot | >100 DCPM but <200 DCPM |
| Daily-cases hotspot | >200 DCPM |
| Growth warmspot | >1% daily growth in new cases |
| Growth hotspot | >5% daily growth in new cases |