This is a summary of COVID-19 trends today, by countries, US states, and California counties.
Summary
| Daily Cases | Daily Growth | |
| World | cold (32 DCPM) | warm (1.2% and cooling) |
| United States | hot (202 DPM) | cool (0.5% and cooling) |
| California | hot (220 DCPM) | warm (2.2% and cooling) |
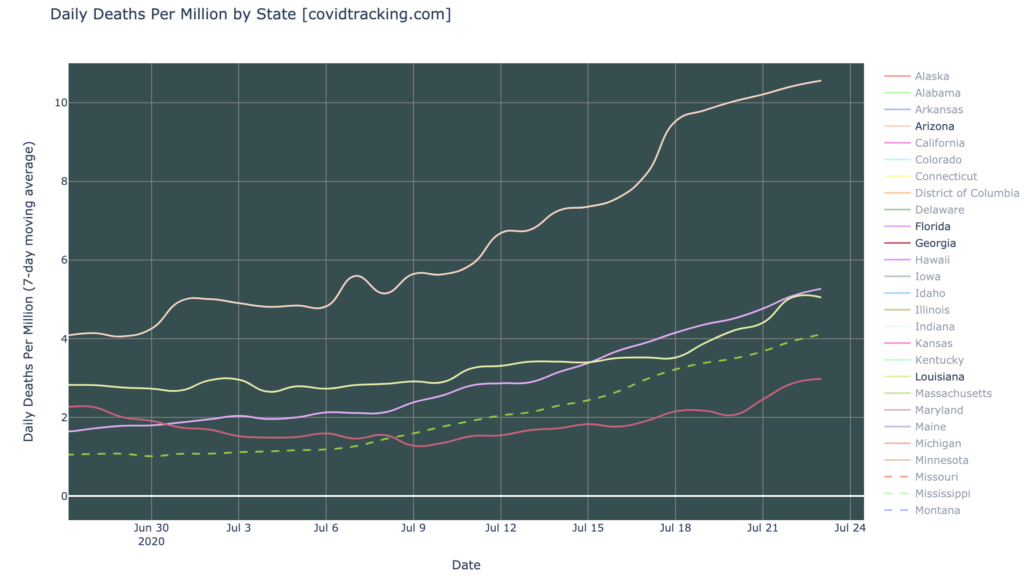
Graph of the Day
Deaths are rising in the hardest-hit states, even those states that have started to show signs of recovery, as deaths lag a couple weeks behind cases:
Countries of the World
Interactive source graphs, where you can select regions, zoom, etc., are here.
The Most Severely Hit Countries Are Trending Toward Recovery
The severity graph shows that the worst-hit countries are Oman, Bahrain, Panama, South Africa, and Israel. Kyrgyzstan is probably also in this list, but with a severity of 2400, it is so hard hit that it wrecks the curve and is omitted from the graph below. Kyrgyzstan has suddenly leapt into a bad place recently, but it’s so recent and so sharp in its rise that I’m not yet sure it’s real, and not a data anomaly. We’ll keep an eye on Kyrgyzstan. But all the other hardest-hit countries are showing a slight and recent downward bend in their severity lines; though they are far from recovery, they are all at least trending that way (see United States, below).
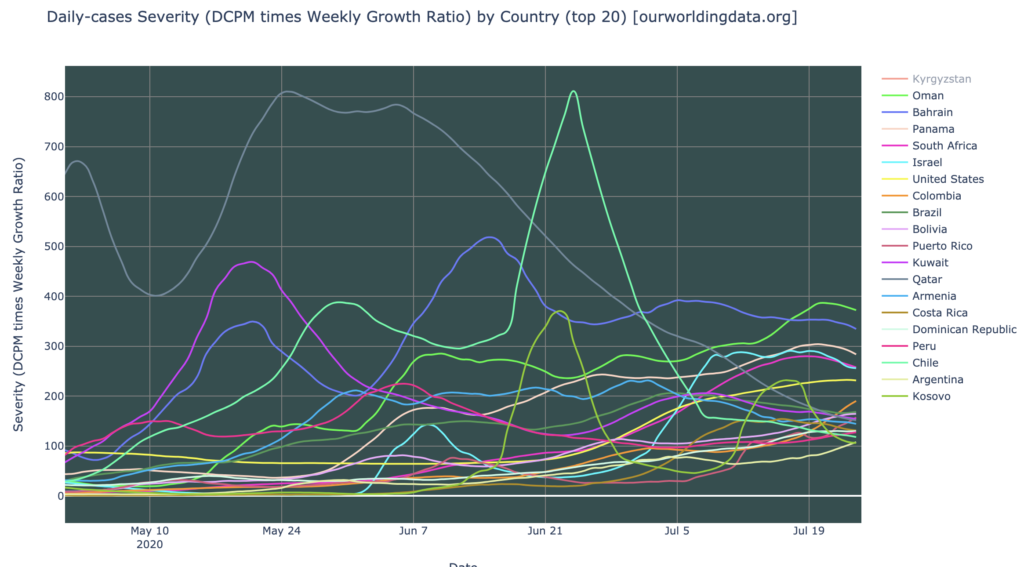
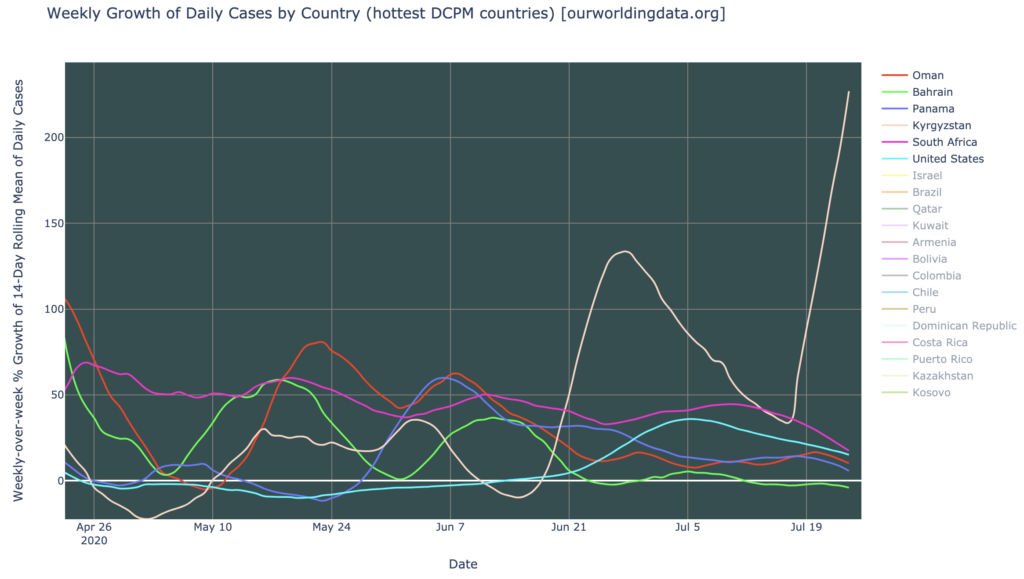
Actually, the United States isn’t quite trending downward in severity (yellow line above), but it’s certainly flattening out there, and in weekly growth (below), it joins the others in a clear trend toward recovery: all of them are seeing growth rates dropping. At this rate, the growth rate of the United States will hit zero in another two or three weeks, and daily numbers will start to drop. But only if the trend continues—all these trends have shown themselves resistant to accurate modeling and prediction. Bahrain, however, appears already to have turned the corner, and daily cases are already dropping there:
States of the United States
Interactive source graphs, where you can select regions, zoom, etc., are here.
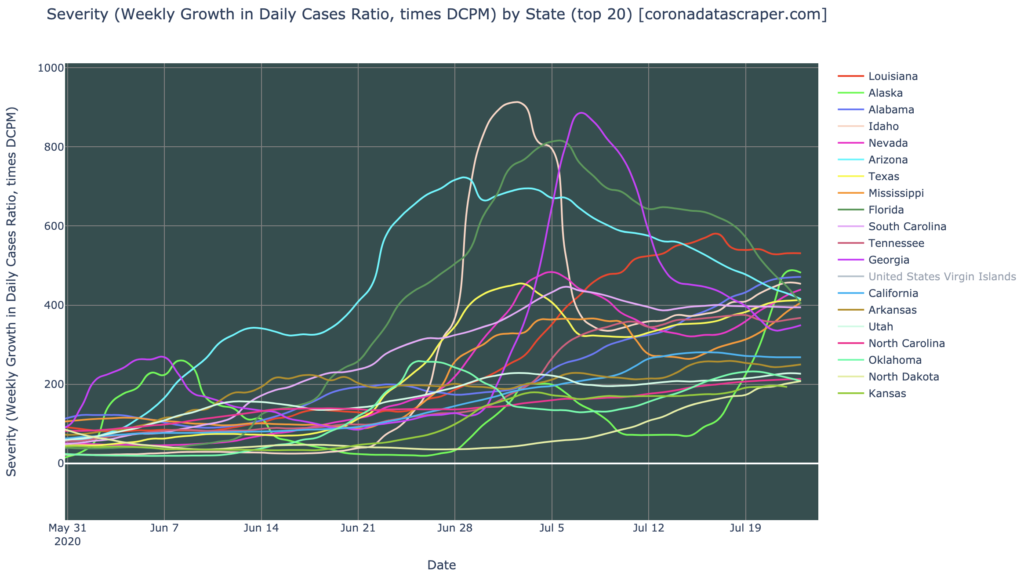
Severity By State
The states don’t look so good from a severity perspective: We have at least 20 severity hotspots. On the bright side, it was just a few weeks ago that we had four or five states at even higher levels of severity: Arizona, Florida, Louisiana, Idaho, and Georgia. As of today, all of these have recovered quite a bit, growth-wise; all are headed in the right direction toward lower growth of daily cases. But a number of states are competing to be the new most-severe: Alaska, Alabama, Nevada, Texas, Mississippi and others; and all of these are still getting worse.
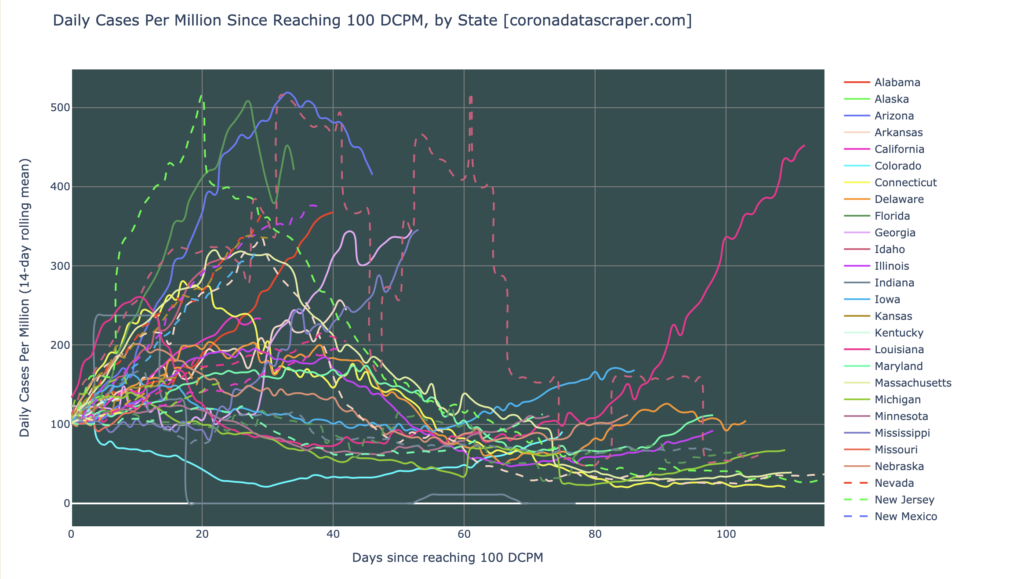
States That Recover, Don’t Get A Second Wave
We continue to see a broad trend, not just among states but among regions at all levels: once a state recovers, from a place of high severity, to a place of low severity, it does not return to high severity. In other words, there are no second waves. The graph below shows that with just one exception (Louisiana), states that reach 100 DCPM typically peak about 30 days later, and have recovered back to 100 DCPM about 40 days later, and do not return to high levels. Louisiana never really recovered—not like, say, New York did—so we could justify its extraordinary performance now as a continuation of its first wave. Note especially that Floria and Arizona, which were some of the recent hardest-hit states, are following the typical trend closely, having peaked around 30 days and now appearing to be headed sharply downward in daily cases, toward a recovery around 70 days.
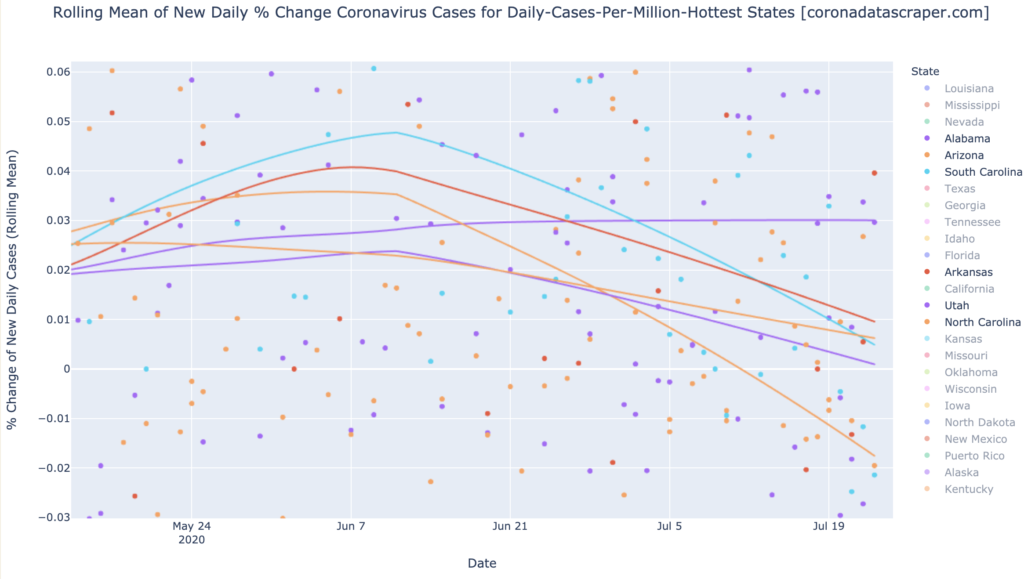
Along these same lines, here is the latest growth graph of the Gang of Six, which I’ve repeatedly focused on. The Gang of Six were bad news a couple months ago, and are mostly still growing in new cases; but their growth rates started trending downward in mid July, and have maintained this course steadily ever since. Arizona is actually shrinking, having turned the corner around July 11; four of the others are at less than 1% daily growth and dropping; and even Alabama, which has been bucking the trend for the past month, is finally flattening out at 3% growth. It is reasonable, having seen so many similar trajectories, to expect all of the currently-most-severe states, to behave similarly over the next couple months. And, there aren’t many states left to catch it now, so once the ones that are severe now recover, we may well rejoin Europe in a state of sustained low-severity.
Deaths Are Rising In The Latest-Wave States
Deaths might be expected to rise a couple weeks after cases rise, due to the progression of the disease: catch it, incubate it, test positive for it, got to the hospital for it, and die from it. (Fortunately, a lot of people recover at each stage). Indeed, deaths are now rising, and not yet falling, in the recent hard-hit states of Arizona, Florida, Louisiana, Texas, and Georgia. Most of these states are now starting to show signs of recovery in daily cases; in a couple weeks we can expect that these deaths graphs will also start to turn downward:

California Counties
Interactive source graphs, where you can select regions, zoom, etc., are here.
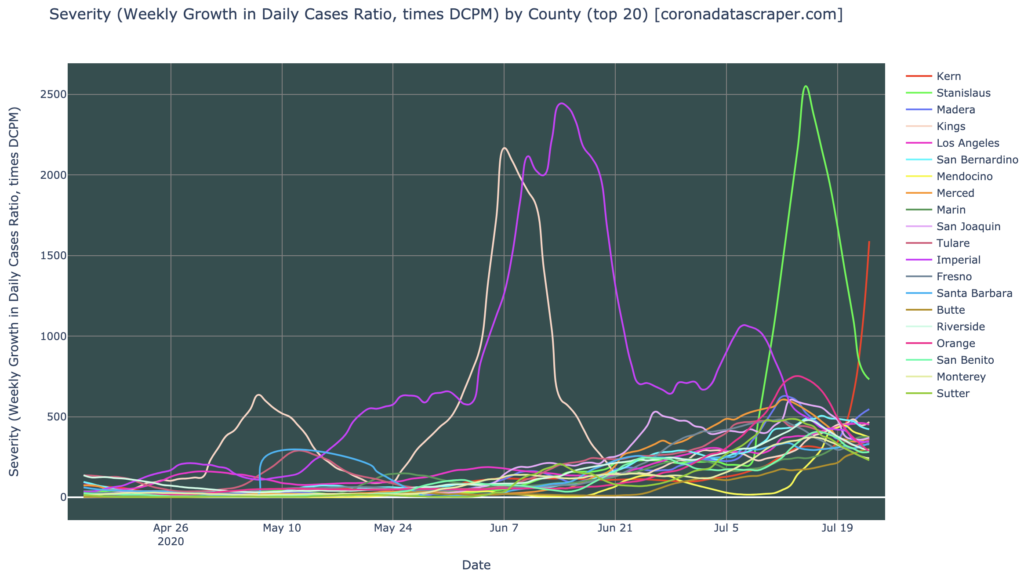
County Severity
Imperial and Kings, which once ruled the state in severity, have recovered back to the level of mere normal hotspots, but now we have Stanislaus and Kern. Stanislaus briefly had the distinction of being the most sever county ever, but is now looking much better—but it’s still worse that anyone but the extreme severity newcomer Kern.
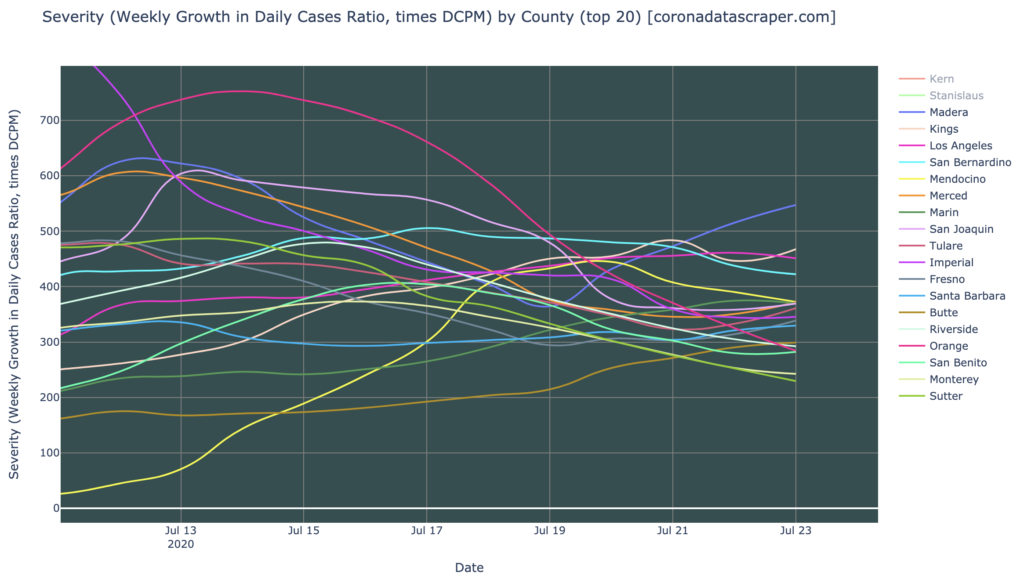
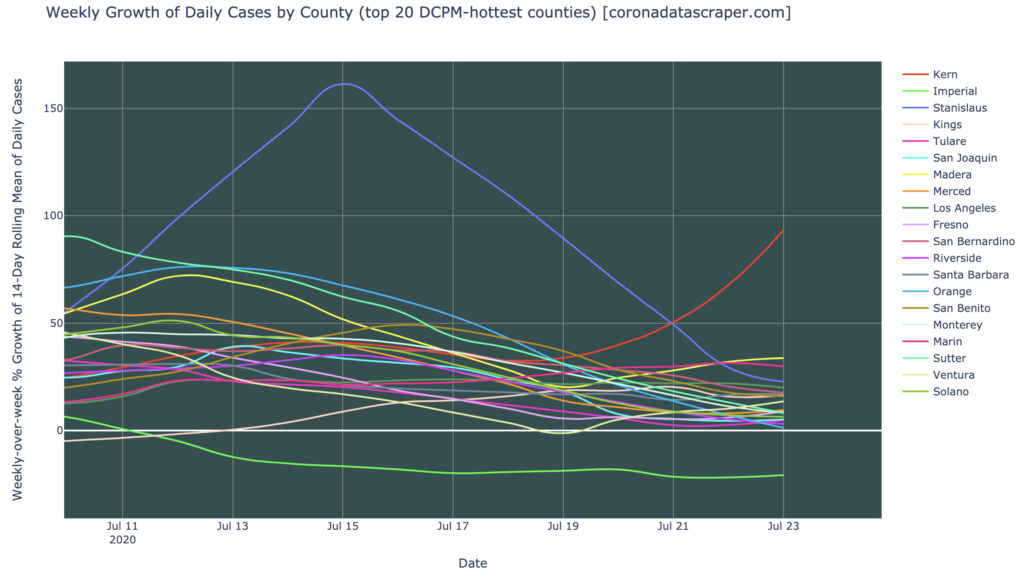
Discarding the weirdly severe ones, we have this, showing that about half of the most severe counties are trending toward less-severe. The other half continue to get worse. This is, at least, better than a few weeks ago, when the trend was universally toward more severe:
The growth graphs, though, still shows that nearly all the highest-DCPM counties are growing in daily new cases (only Imperial is shrinking). So while California is looking somewhat better than a few weeks ago, and shows a trend toward recovery, it’s still in epidemic mode. The true turning-of-the-corner will come when the growth rates of half the counties are below zero:
Definitions
| DCPM | Daily cases per million |
| Daily-cases warmspot | >100 DCPM but <200 DCPM |
| Daily-cases hotspot | >200 DCPM |
| Growth warmspot | >1% daily growth in new cases |
| Growth hotspot | >5% daily growth in new cases |
| Severity | A metric combining DCPM with growth |
| Severity warmspot | >100 Severity but <200 Severity |
| Severity hotspot | >200 Severity |