This is summary of COVID-19 trends today, by countries, US states, and California counties.
Summary
| Daily Cases | Daily Growth | |
| World | cold (16 DCPM) | warm (1.1%) |
| United States | cool (70 DCPM) | warm (1.0%) |
| California | cool (86 DCPM) | warm (2.5%) |
Graph of the Day
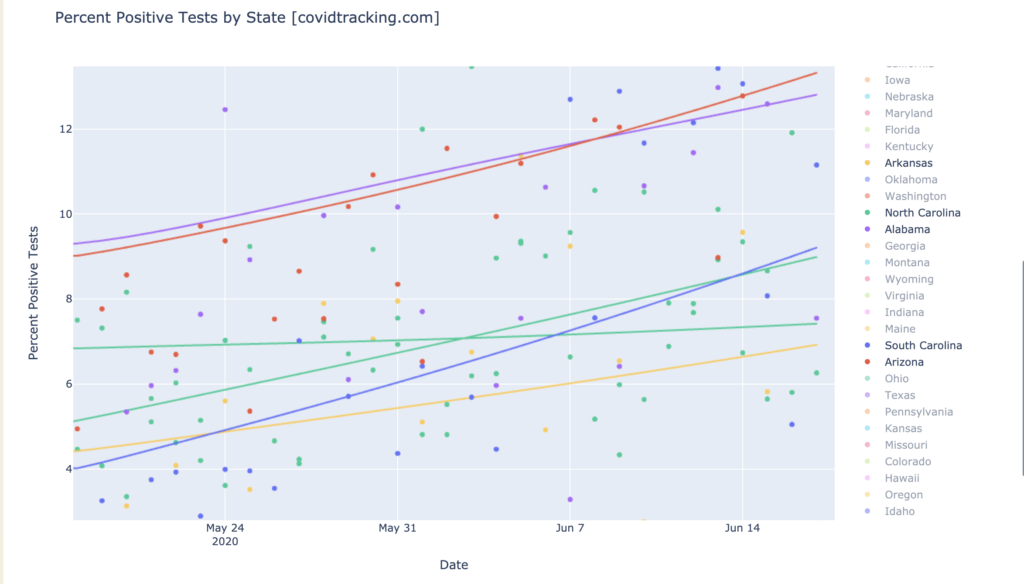
The six US states which are currently growing strongly—the latest wave of hard-hit states—are also seeing growth of their positive test rate, suggesting a genuine growth of infections there:
Countries of the World
Interactive source graphs, where you can select regions, zoom, etc., are here.
Hotspot Countries
There are five daily-cases hotspot counties (>200 DCPM): Qatar, Bahrain, Chile, Oman, and Armenia:
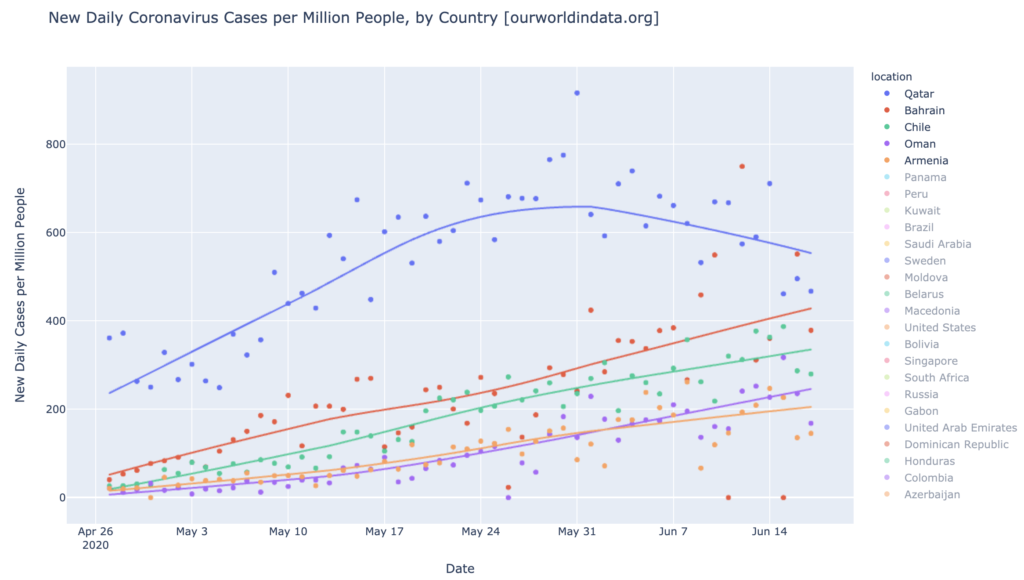
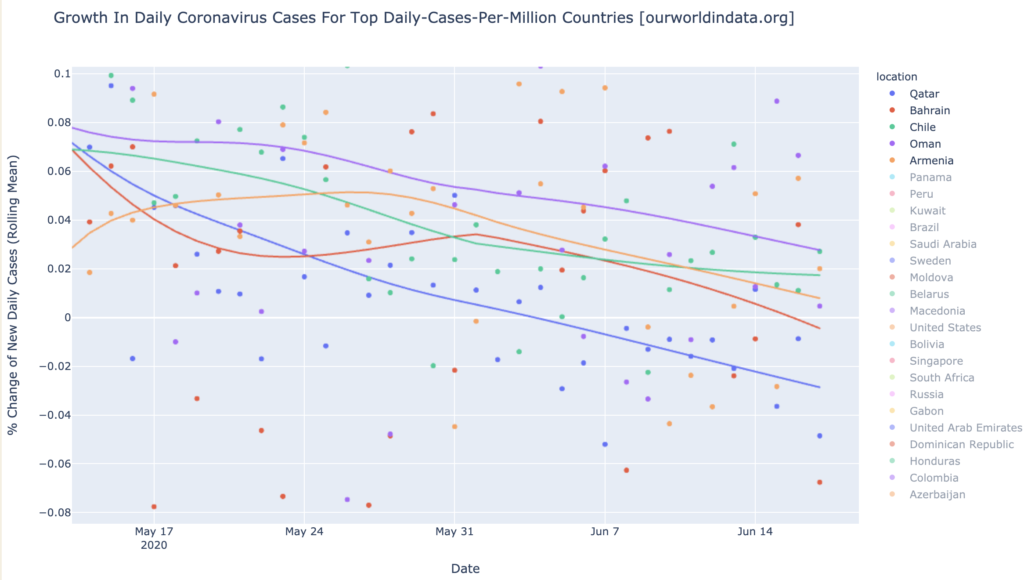
All of these five daily-cases hotspot countries are trending downward in growth rate. Oman, Chile, and Armenia are still growing in daily new cases; Qatar and Bahrain have turned the corner and are now shrinking in daily cases; but all five are trending toward recovery, as shown by the downward trend of their growth rates:
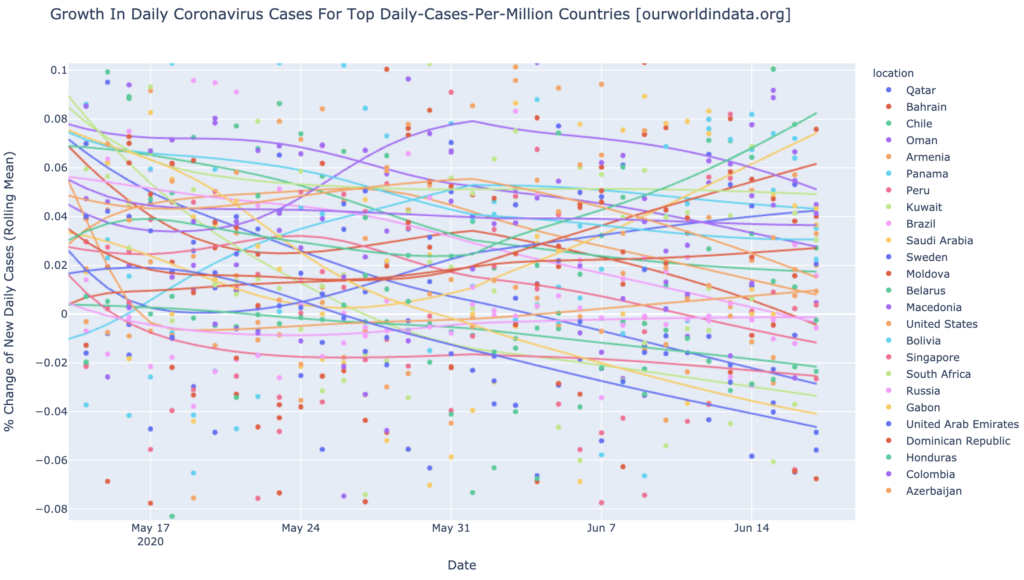
The “rope chart” as a whole is showing most of the daily-warmest countries also trending downward in growth rate; most of these are still growing in new cases, but their growth rates are mostly angled downward, indicating a trend toward recovery. Only three show a really problematic high-growth-and-accelerating (the top three at the top right in the graph below: green, yellow, and red), Honduras, Panama, and Moldava:
United States (among the countries)
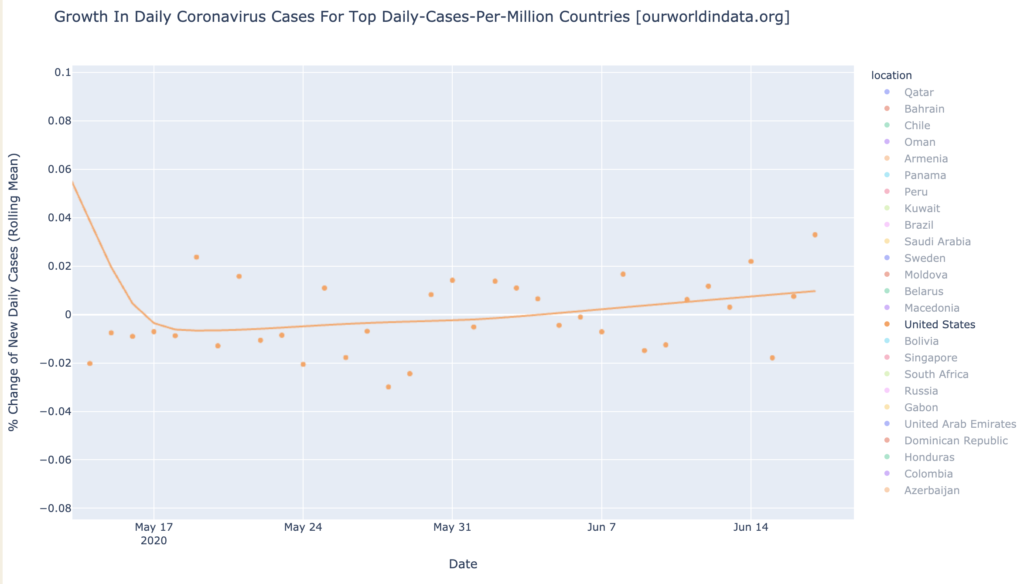
The United States is not daily-cases warmspot, at only 70 DCPM:
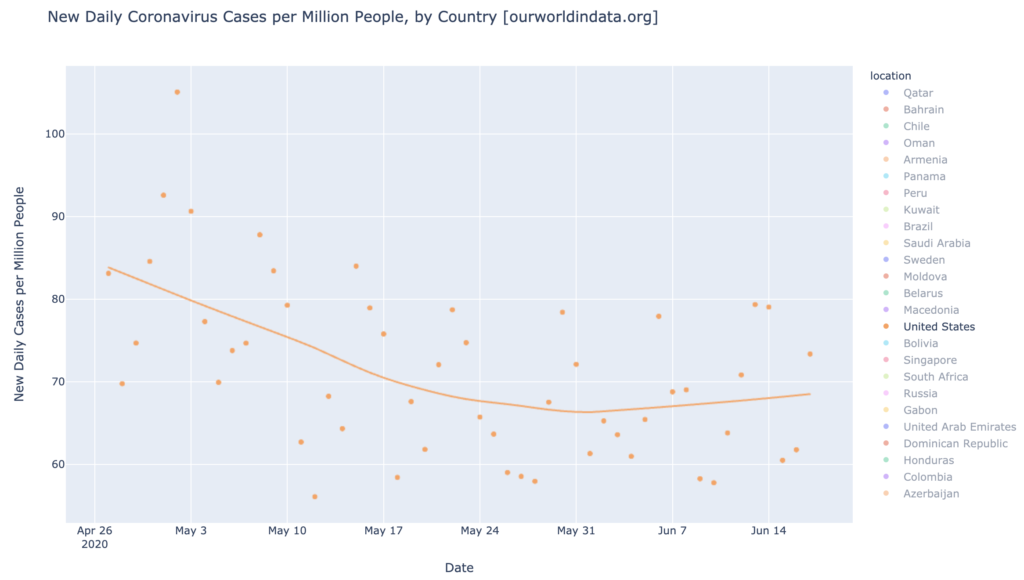
The United States is very close to a daily-cases warmspot, at just under 1% growth in daily cases, and warming:
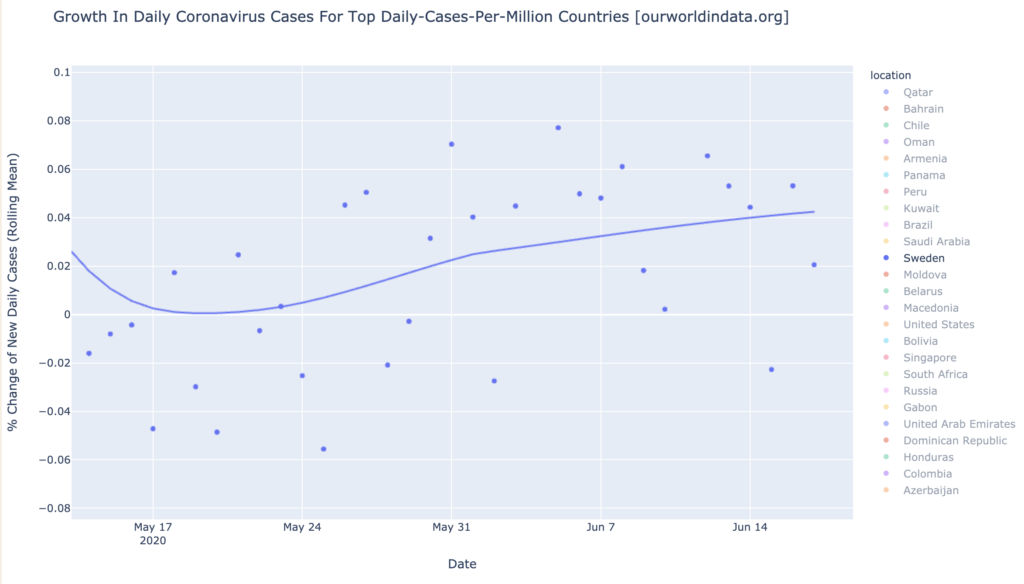
Sweden
Sweden, oddly, has resurged from Europe’s general recovery, and is showing the problematic combination of being a daily-cases warmspot (104 DCPM), and very warm growth warmspot (4.2% growth in new daily cases and rising:
States of the United States
Interactive source graphs, where you can select regions, zoom, etc., are here.
Hotspots
There are no state daily-cases hotspots (>200 DCPM). Growth hotspot states (>5%) are Arkansas, South Carolina, Arizona, Nevada, and Alabama.
The Gang of Six: Arizona, Alabama, Arkansas, North and South Carolina, and Utah
These six states continue to be the COVID-19 news for the United States. All are daily-cases warmspots (>100 DCPM):
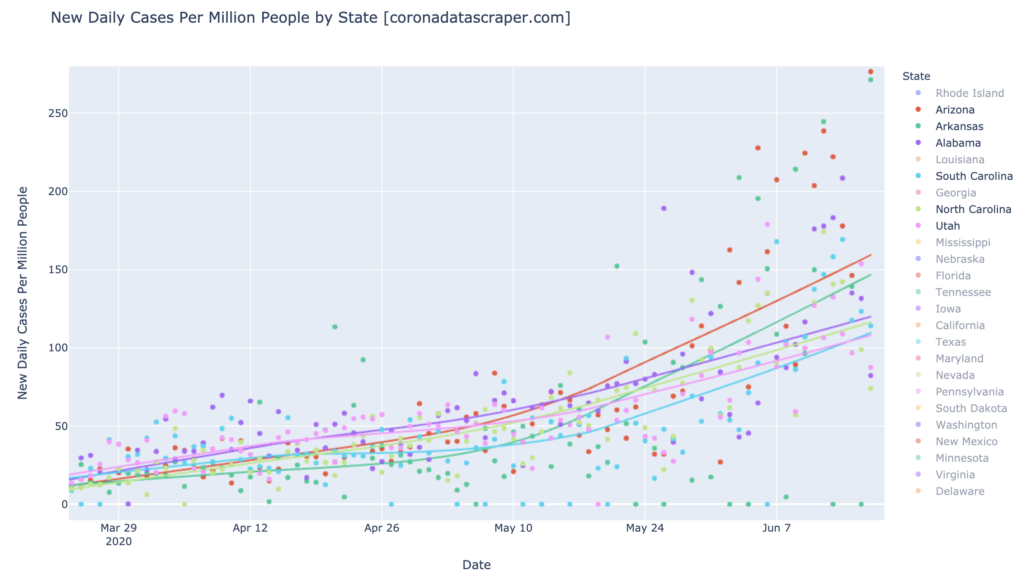
If these were countries, they would be in the top 10 warmest countries worldwide.
All six are also growing rapidly, from 3% daily for North Carolina, to 8% daily for Arkansas. With the exception of North Carolina, the growth of all is accelerating:
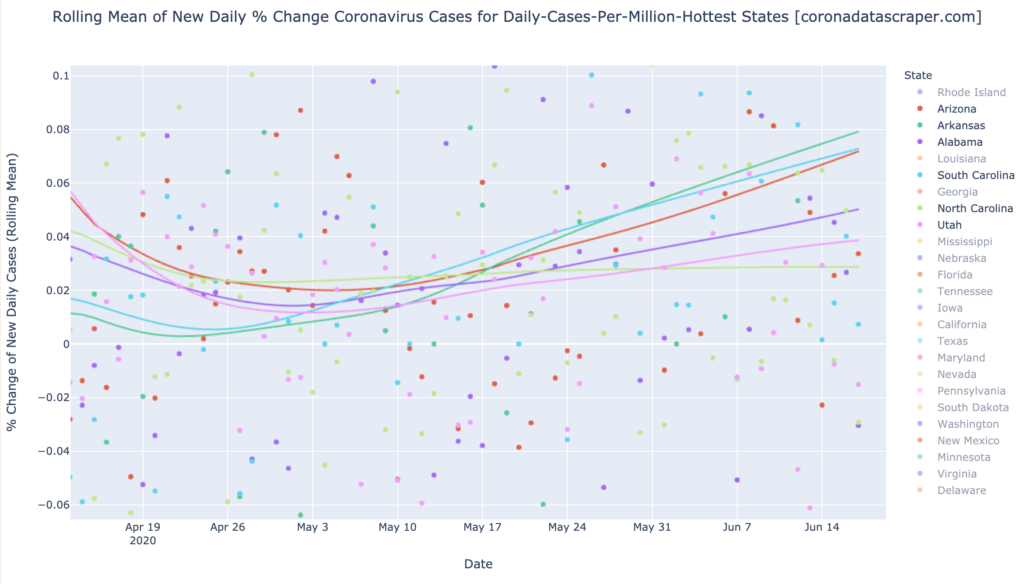
None of these six, however, are currently hotspots (>200 DCPM). Recall that New York at its worst was around 1400 DCPM, so these six states are not in that kind of trouble yet. It will take months for them to get there, if they do. From my own examination of many such graphs over the past few months, I consider it much more likely that they will peak in the low hundreds in the next couple weeks, and then recover.
Whereas almost all states are showing a steady decline in the number of positive tests, these six states all show the number of positive tests rising. This suggests (but does not prove) that these states are not just seeing the rises in new cases due to higher testing, but due to rising numbers of actual new infections:
California (among the States)
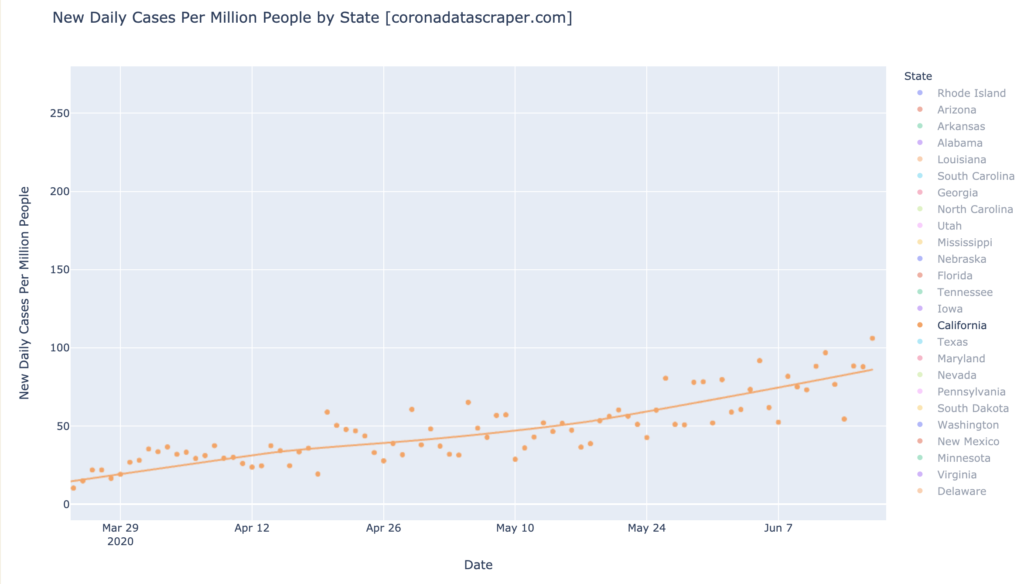
California is still not even warm in daily cases (it is at 86 DCPM, below the 100 DCPM definition of “warm”), but it just had its first warm day, and is trending in that direction:
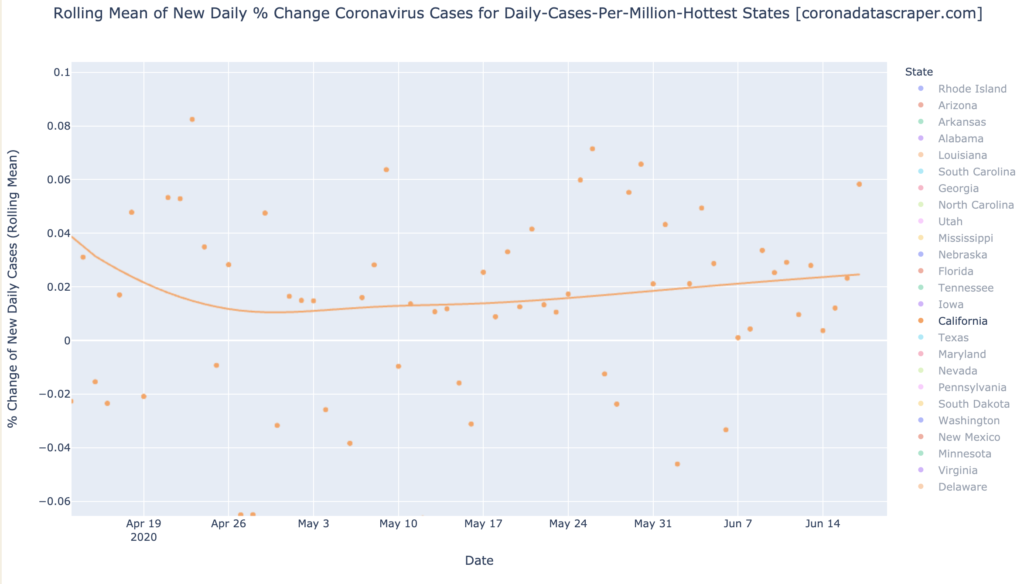
California is growth warmspot, at 2.4% growth in daily cases. Its latest data point, an average of the growth rates of the past seven days, is an alarming 5.8%, which if persisted, would qualify it as a growth hotspot. One datapoint does not make a trend, so we’ll keep an eye on this:
California Counties
Interactive source graphs, where you can select regions, zoom, etc., are here.
Hotspots and Warmspots
Imperial and Kings continue to be the state’s daily-cases warmspots, at 800 DCPM and 240 DCPM, respectively.
Los Angeles is a daily-cases warmspot at 144 DCPM; Riverside has just become a daily-cases warmspot, rising to 101 DCPM.
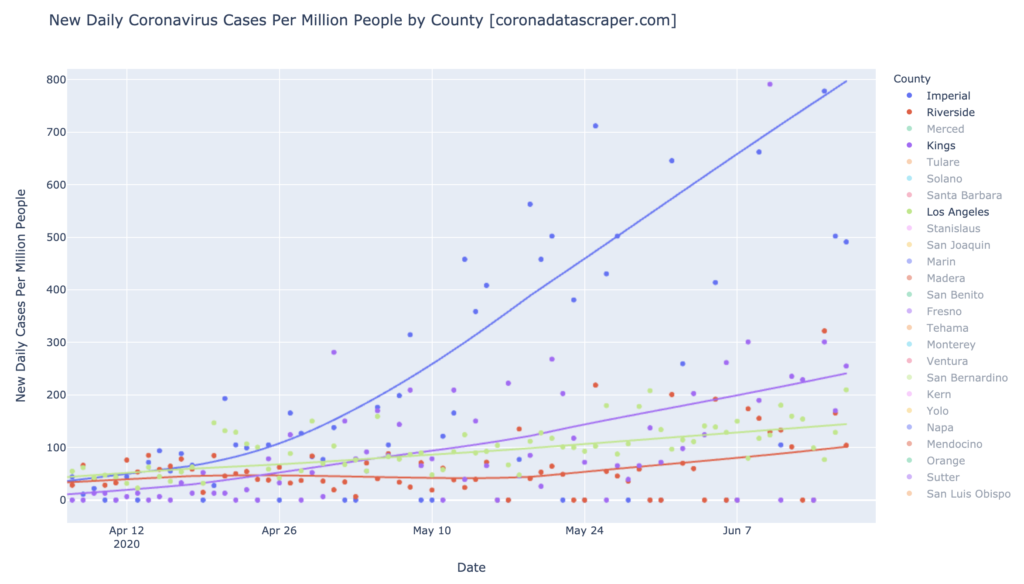
Most Warm Counties Are Getting Worse
Almost all of the top-25 counties in DCPM, are also growing. Use the interactive version to zoom in on particular counties (or hover in that version to see which is which) to see which line is which; but the worst, top to bottom, are Madera (red) at 14%, and San Luis Obispo (top orange) at 11%. These are very high growth rates:
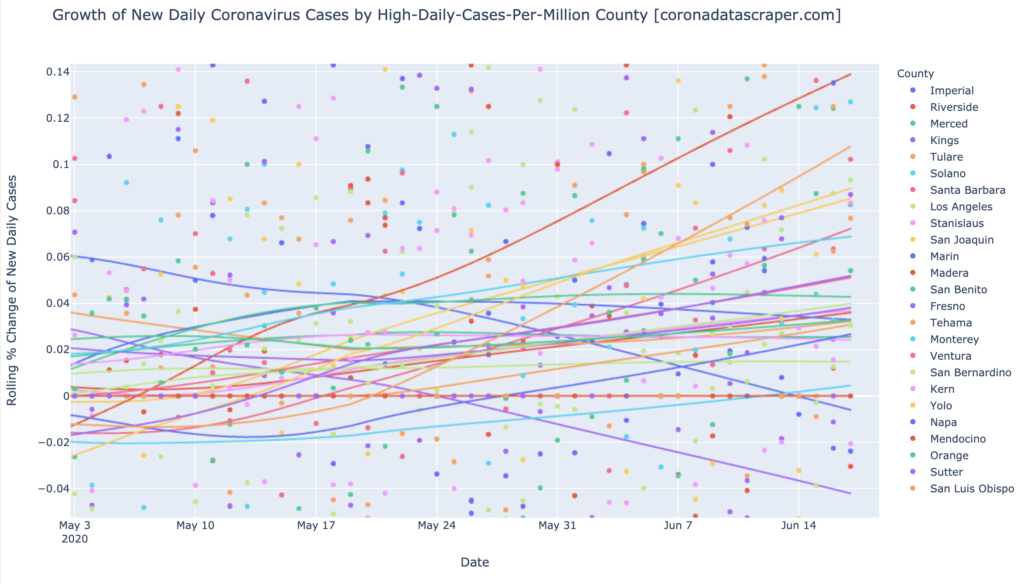
The thicker horizontal line is the zero line; almost all counties are above this line, indicating daily growth of new cases. The major exceptions are Kings (bottom purple) and Imperial (bottom blue). On the bright side, those two are the hottest counties in daily cases, so the worst two counties, are also the ones which are recovering.
If the other counties follow the trajectories of past regions, they will likely rise linearly, peak in the next few weeks, and fall in a slightly-slower linear rate than they rose. This is not certain, however, nor deduced from these graph; it is just likely based on past trajectories.
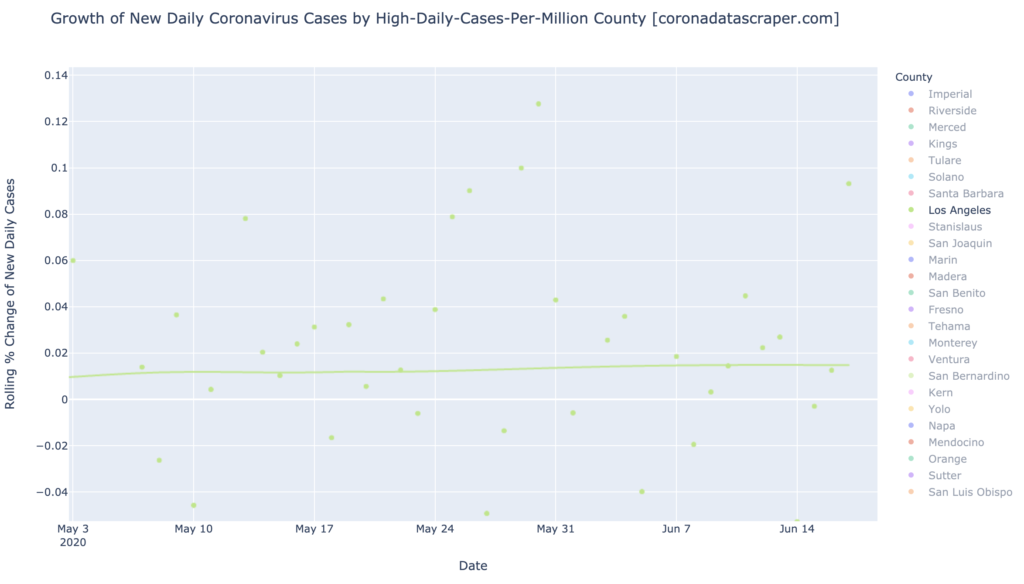
Los Angeles
Los Angeles has contributed half of the total cases of California, so its trajectory has a major impact on the trajectory of California.
As shown in the graph above, Los Angeles is not a daily-cases hotspot, but it is a daily-cases warmspot at 144 DCPM. It is also a growth warmspot (but not a growth hotspot) at 1.5%:
Definitions
| DCPM | Daily cases per million |
| Daily-cases warmspot | >100 DCPM but <200 DCPM |
| Daily-cases hotspot | >200 DCPM |
| Growth warmspot | >1% daily growth in new cases |
| Growth hotspot | >5% daily growth in new cases |